Playable air · 1.08×
 DET @ TEX

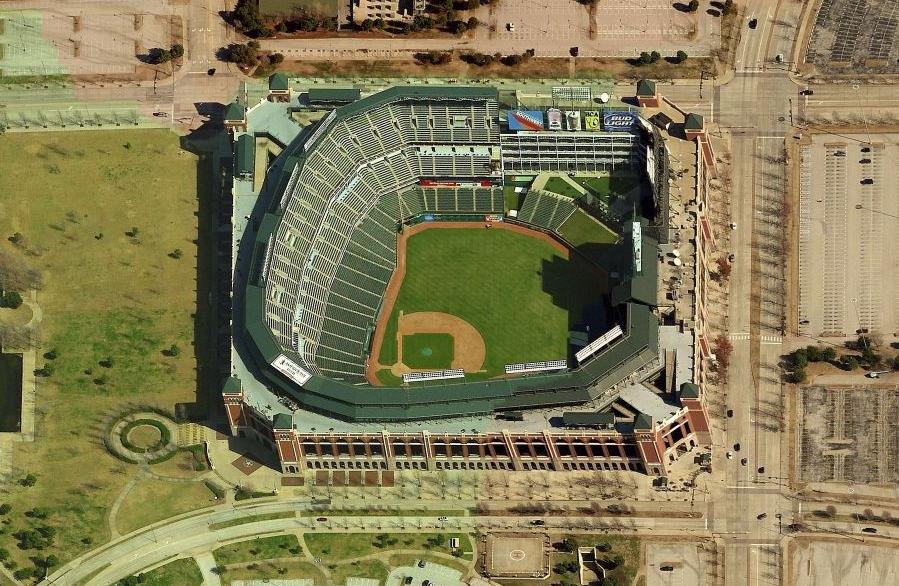
Globe Life Field
· 4:05p
· 15 ranked batters
Park 0.98×
Wind 4 mph slight_out
81°F
Roof retractable
Best of game
Joc Pederson
conv 42 · vs Flaherty
⟷
Kerry Carpenter
conv 31 · vs Rocker
→ edge: Joc Pederson
leak 72
1.18 HR/9 · FIP−xFIP -0.16 · leakiest side of this game
leak 22
0.91 HR/9 · FIP−xFIP -0.01 · stingy — thin edge
One pick per game — the round-robin guard fires on a second lock here.
The verdict pick is Joc Pederson: Match 28.4% · 14D pace 55.6% · platoon edge.
Verdict = model score + conviction (½·14D pace + ½·Match%); odds shown are the live best price, never invented.
price
power
form ✶
matchup ✶
score
#batter
oddsiso · ev · brl%
14d pacematch% · f b o
Below the fade line · 11 long shots
Fade line = model score below 50 (the model's own Below tier — the spec's confidence threshold mapped to our real tiers).
✶ marks the verdict pick · side dot: attack / fade ·
F·B·O = the bat's real Barrel% vs each pitch family (same scale as the Threat Matrix).
Rows without a 14D pace or Match% value show dashes and sort last on those keys.
Threat Matrix
tonight's lineup × the starter's arsenal families
FB 55.6% ← leak
BRK 38.4%
OFF 5.9%
Overall
Score
Neutral · 3
Long shots · 5 — below the fade line
Read the columns: the fastball family (55.6% usage) carries Rocker's damage — FB is the leak.
5 of 8 listed bats hold the platoon edge.
Cells are each batter's season damage vs that family (not vs this pitcher specifically).
FB 53.3%
BRK 44.4%
OFF 2.3%
Overall
Score
Neutral · 1
Long shots · 6 — below the fade line
Read the columns: no single family leads Flaherty's damage — the leak is spread across the arsenal.
4 of 7 listed bats hold the platoon edge.
Cells are each batter's season damage vs that family (not vs this pitcher specifically).
Form × Fit
14-day HR pace (form) against HR/FB matchup fit — both axes 0–40, real slate values
LOCK ZONE
14d pace ↑
match% →
Dingler
Carpenter
Greene
Keith
Pederson
Burger
Legend
attack side — vs Flaherty
fade side
dot size = HR score · gold ring = locked
Lock Zone = 14D pace ≥ 20% AND Match% ≥ 18 (spec thresholds; both are the site's warm/top-quartile lines)
In the lock zone · 3
Joc Pederson
+350 · 61
Kerry Carpenter
+335 · 57
Dillon Dingler
+425 · 61
Stadium conditions
Globe Life Field
First pitch 3:05p
· roof retractable
Park 0.98×
Wind 4 mph slight_out
81°F
retractable
+8
↑
8 mph · out
93°F
3:05p
+8
↑
8 mph · out
96°F
4:05p
+8
↑
8 mph · out
97°F
5:05p
+9
↑
9 mph · out
97°F
6:05p · peak
+9
↑
9 mph · out
98°F
7:05p
arrow = wind over the diamond, plate → CF (↑ out · ↓ in · → cross) · FIT = signed park+weather HR signal per hour
vs Kumar Rocker · RHP
0.91 HR/9 · FIP−xFIP -0.01 · 8 batters
#batter
scoretier
oddsform
rank
isoevbarrel%
hr/fbhr dist
sea hr%14d pace
match%bbe
vs Jack Flaherty · RHP
1.18 HR/9 · FIP−xFIP -0.16 · 7 batters
#batter
scoretier
oddsform
rank
isoevbarrel%
hr/fbhr dist
sea hr%14d pace
match%bbe
Hot wash = top of this side's column (percentile ≥ .6) · cool wash = bottom (≤ .4) · BBE is sample size, never tinted.
The vs-hand chip on HR/FB marks a real handedness split; unchipped values are overall. Click a row for the full matchup overlay.