 TB
TB
@
7:40p
 KC
KC
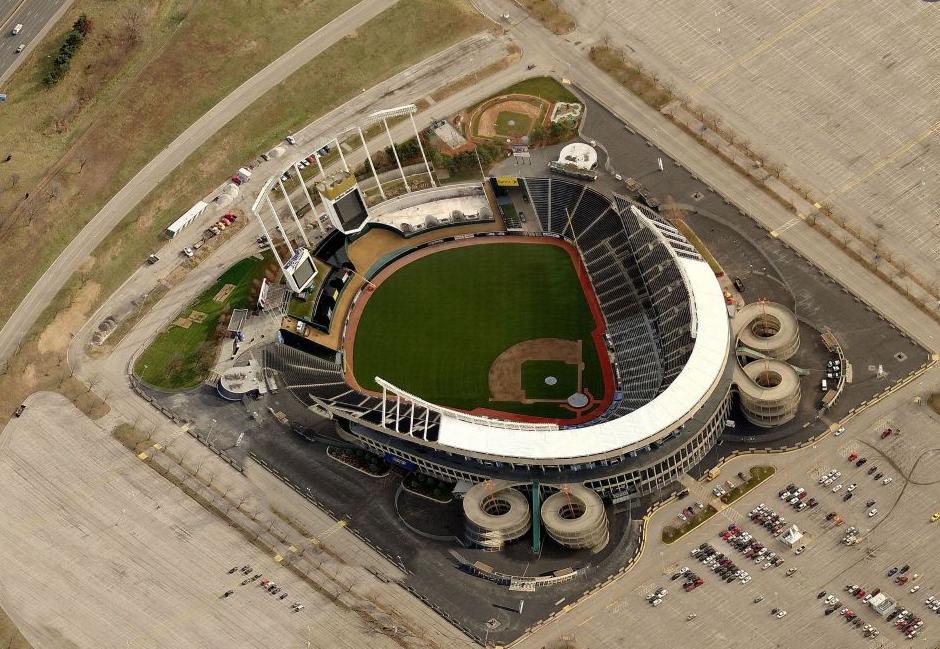
Stadium Conditions
Kauffman Stadium
First pitch 6:40p
· roof open
Park 1.00×
Wind 3 mph cross
79°F
open
+8
15 mph · slight_out
88°F
6:40p
Boost for HR environment
+7
15 mph · slight_out
86°F
7:40p
Boost for HR environment
+7
14 mph · slight_out
84°F
8:40p
Boost for HR environment
+6
13 mph · slight_out
82°F
9:40p
Boost for HR environment
+6
13 mph · slight_out
82°F
10:40p
Boost for HR environment
⚪ Elevated · Combined 1.10
79°F, wind 3 mph SSE (cross) — modifier: +1. Park, wind, temperature, and roof are inputs to Combined, not separate signals to stack on top.

6 batters
| # | Batter | Score | Tier | Odds | Form | Rank | ISO ?Isolated Power — career SLG minus AVG. >.220 elite, .180–.220 above avg, <.140 below avg. | EV ?Avg Exit Velocity (mph) — Statcast season-to-date. >92 elite, 89–92 above avg, <86 below avg. | Barrel% ?Barrel rate vs. this pitch mix — percentage of contact classified as barrels (perfect EV + LA combo). >12% elite, 8–12% above avg. | HR/FB ?Batter HR / Fly Ball rate for this matchup. A vs LHP/vs RHP chip means a handedness split is shown; otherwise the value is overall. | HR Dist ?Average distance (ft) of this batter's HRs. >400ft elite raw power, 380–400 above avg. | Sea HR% ?Season HR rate (HRs / PAs so far this year). v3.5 model feature — top backtest contributor. | 14d Pace ?Recent 14-day HR pace (HRs / games started). v3.5 model feature — captures current form. | Match% ?HR/FB Matchup — combined batter × pitcher HR/FB rate. The headline "how favorable is this matchup" number. | BBE ?Sample size — batted-ball events. <30 = small sample, treat stats with caution. | |
|---|---|---|---|---|---|---|---|---|---|---|---|---|---|---|---|---|
| 1 |

|
Jac Caglianone | 62 | 🔵 C+ | +370 | 🔥 HOT | 23 | 0.212 | 94.0 | 13.3% | 29.0% vs RHP | 418 | 13.7% | 36.4% | 31.3% | 29 |
| 2 |

|
Carter Jensen | 53 | 🟠 C | +350 | · | 65 | 0.184 | 91.0 | 9.3% | 18.2% vs RHP | 385 | 14.5% | 27.3% | 22.8% | 38 |
| 3 |

|
Michael Massey | 47 | ⚪ D | +475 | ❄ COLD | 100 | 0.182 | 90.5 | 8.8% | 11.1% vs RHP | 398 | 8.0% | 10.0% | 12.8% | 35 |
| 4 |

|
Salvador Perez | 42 | ⚪ D | +390 | 🌤️ WARM | 139 | 0.147 | 88.8 | 9.9% | 16.3% vs RHP | 394 | 0.0% | 0.0% | 9.6% | 39 |
| 5 |

|
Lane Thomas | 41 | ⚪ D | +525 | 🌤️ WARM | 141 | 0.115 | 87.5 | 6.7% | 16.7% vs RHP | 413 | 13.0% | 18.2% | 10.0% | 35 |
| 6 |

|
Isaac Collins | 36 | ⚪ D | +750 | ❄ COLD | 181 | 0.091 | 88.6 | 7.7% | 6.1% vs RHP | 377 | 4.3% | 0.0% | 8.5% | 33 |

9 batters
| # | Batter | Score | Tier | Odds | Form | Rank | ISO ?Isolated Power — career SLG minus AVG. >.220 elite, .180–.220 above avg, <.140 below avg. | EV ?Avg Exit Velocity (mph) — Statcast season-to-date. >92 elite, 89–92 above avg, <86 below avg. | Barrel% ?Barrel rate vs. this pitch mix — percentage of contact classified as barrels (perfect EV + LA combo). >12% elite, 8–12% above avg. | HR/FB ?Batter HR / Fly Ball rate for this matchup. A vs LHP/vs RHP chip means a handedness split is shown; otherwise the value is overall. | HR Dist ?Average distance (ft) of this batter's HRs. >400ft elite raw power, 380–400 above avg. | Sea HR% ?Season HR rate (HRs / PAs so far this year). v3.5 model feature — top backtest contributor. | 14d Pace ?Recent 14-day HR pace (HRs / games started). v3.5 model feature — captures current form. | Match% ?HR/FB Matchup — combined batter × pitcher HR/FB rate. The headline "how favorable is this matchup" number. | BBE ?Sample size — batted-ball events. <30 = small sample, treat stats with caution. | |
|---|---|---|---|---|---|---|---|---|---|---|---|---|---|---|---|---|
| 1 |

|
Junior Caminero | 62 | 🔵 C+ | +235 | 🌤️ WARM | 24 | 0.248 | 93.4 | 10.5% | 37.5% vs LHP | 405 | 24.4% | 41.7% | 30.2% | 34 |
| 2 |

|
Jonathan Aranda ⚡ | 48 | ⚪ D | +475 | 🌧️ COOL | 96 | 0.184 | 90.7 | 9.2% | 7.1% vs LHP | 391 | 14.5% | 16.7% | 11.7% | 37 |
| 3 |

|
Yandy Diaz | 39 | ⚪ D | +320 | 🌤️ WARM | 162 | 0.174 | 90.9 | 7.9% | 18.2% vs LHP | 385 | 0.0% | 0.0% | 10.4% | 32 |
| 4 |

|
Cedric Mullins | 38 | ⚪ D | · | 🌤️ WARM | 170 | 0.121 | 88.3 | 5.9% | 0.0% vs LHP | 394 | 11.1% | 22.2% | 10.7% | 25 |
| 5 |

|
Ben Williamson | 32 | ⚪ D | +850 | ❄ COLD | 198 | 0.104 | 88.1 | 3.5% | 14.3% vs LHP | 398 | 3.4% | 20.0% | 9.4% | 16 |
| 6 |

|
Richie Palacios ⚡ | 29 | ⚪ D | · | 🌧️ COOL | 213 | 0.074 | 86.2 | 5.0% | 2.4% | 382 | 0.0% | 0.0% | 7.0% | 26 |
| 7 |

|
Taylor Walls | 28 | ⚪ D | +850 | 🌤️ WARM | 219 | 0.070 | 84.5 | 5.4% | 0.0% vs LHP | 0 | 0.0% | 0.0% | 5.8% | 27 |
| 8 |

|
Nick Fortes | 26 | ⚪ D | +750 | ❄ COLD | 221 | 0.068 | 86.0 | 3.2% | 0.0% vs LHP | 408 | 0.0% | 0.0% | 5.8% | 18 |
| 9 |

|
Chandler Simpson | 18 | ⚪ D | · | 🌧️ COOL | 223 | 0.060 | 84.1 | · | 0.0% vs LHP | 0 | 0.0% | 0.0% | 6.6% | 39 |