 PHI
PHI
@
—
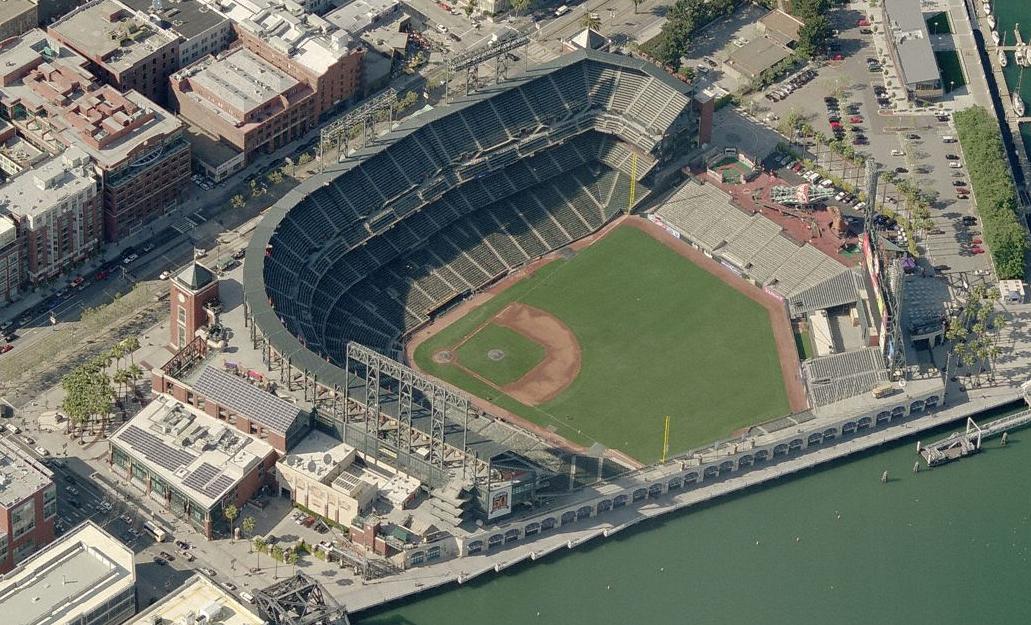
 SF
SF
Park Factor
0.87×
Weather Mod
-2.0%
cold air · light wind out · roof open
Combined
0.696
Temp
50.7°F
Wind
5.0 mph
out
Roof
open

9 batters
| # | Batter | Score | Tier | Odds | Form | Rank | ISO ?Isolated Power — career SLG minus AVG. >.220 elite, .180–.220 above avg, <.140 below avg. | EV ?Avg Exit Velocity (mph) — Statcast season-to-date. >92 elite, 89–92 above avg, <86 below avg. | Barrel% ?Barrel rate vs. this pitch mix — percentage of contact classified as barrels (perfect EV + LA combo). >12% elite, 8–12% above avg. | HR/FB ?Batter HR / Fly Ball rate — career, all pitchers. >18% elite, 14–18% above avg, <10% below avg. | HR Dist ?Average distance (ft) of this batter's HRs. >400ft elite raw power, 380–400 above avg. | Sea HR% ?Season HR rate (HRs / PAs so far this year). v3.5 model feature — top backtest contributor. | 14d Pace ?Recent 14-day HR pace (HRs / games started). v3.5 model feature — captures current form. | Match% ?HR/FB Matchup — combined batter × pitcher HR/FB rate. The headline "how favorable is this matchup" number. | BBE ?Sample size — batted-ball events. <30 = small sample, treat stats with caution. | |
|---|---|---|---|---|---|---|---|---|---|---|---|---|---|---|---|---|
| 1 |

|
Kyle Schwarber | 68 | 🔵 C+ | · | · | 13 | 0.323 | 94.3 | 12.9% | 28.6% | 410 | 25.0% | 25.0% | 19.5% | 21 |
| 2 |

|
Bryce Harper | 46 | ⚪ D | · | 🌧️ COOL | 102 | 0.226 | 91.3 | 9.9% | 18.5% | 404 | 12.5% | 12.5% | 9.9% | 35 |
| 3 |

|
Max Kepler | 37 | ⚪ D | · | · | 166 | 0.175 | 90.8 | 9.6% | 12.2% | 389 | 0.0% | 0.0% | 6.7% | 0 |
| 4 |

|
Bryson Stott | 37 | ⚪ D | · | 🔥 HOT | 169 | 0.134 | 87.6 | 6.4% | 7.8% | 395 | 0.0% | 0.0% | 3.3% | 26 |
| 5 |

|
Nick Castellanos | 33 | ⚪ D | · | 🌤️ WARM | 185 | 0.150 | 87.8 | 7.8% | 10.6% | 396 | 0.0% | 0.0% | 4.3% | 16 |
| 6 | J.T. Realmuto | 32 | ⚪ D | · | 🌧️ COOL | 192 | 0.127 | 90.0 | 8.4% | 9.3% | 408 | 12.5% | 12.5% | 3.8% | 19 | |
| 7 |

|
Brandon Marsh | 30 | ⚪ D | · | 🌧️ COOL | 207 | 0.164 | 91.1 | 8.2% | 11.7% | 395 | 0.0% | 0.0% | 4.9% | 30 |
| 8 |

|
Trea Turner | 27 | ⚪ D | · | 🌧️ COOL | 218 | 0.153 | 89.3 | 6.8% | 9.4% | 393 | 0.0% | 0.0% | 4.1% | 37 |
| 9 |

|
Alec Bohm | 27 | ⚪ D | · | ❄ COLD | 219 | 0.123 | 90.8 | 7.0% | 10.0% | 386 | 12.5% | 12.5% | 3.6% | 34 |

Aaron Nola
RHP
9 batters
| # | Batter | Score | Tier | Odds | Form | Rank | ISO ?Isolated Power — career SLG minus AVG. >.220 elite, .180–.220 above avg, <.140 below avg. | EV ?Avg Exit Velocity (mph) — Statcast season-to-date. >92 elite, 89–92 above avg, <86 below avg. | Barrel% ?Barrel rate vs. this pitch mix — percentage of contact classified as barrels (perfect EV + LA combo). >12% elite, 8–12% above avg. | HR/FB ?Batter HR / Fly Ball rate — career, all pitchers. >18% elite, 14–18% above avg, <10% below avg. | HR Dist ?Average distance (ft) of this batter's HRs. >400ft elite raw power, 380–400 above avg. | Sea HR% ?Season HR rate (HRs / PAs so far this year). v3.5 model feature — top backtest contributor. | 14d Pace ?Recent 14-day HR pace (HRs / games started). v3.5 model feature — captures current form. | Match% ?HR/FB Matchup — combined batter × pitcher HR/FB rate. The headline "how favorable is this matchup" number. | BBE ?Sample size — batted-ball events. <30 = small sample, treat stats with caution. | |
|---|---|---|---|---|---|---|---|---|---|---|---|---|---|---|---|---|
| 1 |

|
Willy Adames | 50 | 🟠 C | · | · | 74 | 0.196 | 88.9 | 10.7% | 15.1% | 401 | 11.1% | 11.1% | 12.9% | 33 |
| 2 |

|
Dominic Smith | 47 | ⚪ D | · | 🌤️ WARM | 96 | 0.132 | 87.7 | 6.2% | 8.3% | 396 | 20.0% | 20.0% | 10.9% | 20 |
| 3 |

|
Matt Chapman | 43 | ⚪ D | · | ❄ COLD | 122 | 0.198 | 92.2 | 9.5% | 14.8% | 399 | 11.1% | 11.1% | 12.9% | 37 |
| 4 |

|
Wilmer Flores | 42 | ⚪ D | · | 🔥 HOT | 129 | 0.138 | 85.9 | 6.6% | 10.7% | 378 | 0.0% | 0.0% | 12.9% | 32 |
| 5 |

|
Casey Schmitt | 38 | ⚪ D | · | · | 162 | 0.163 | 89.5 | 9.0% | 12.1% | 394 | 0.0% | 0.0% | 9.6% | 17 |
| 6 |

|
Heliot Ramos | 33 | ⚪ D | · | 🌧️ COOL | 183 | 0.144 | 91.8 | 8.9% | 11.9% | 403 | 0.0% | 0.0% | 8.4% | 27 |
| 7 |

|
Patrick Bailey | 28 | ⚪ D | · | · | 214 | 0.103 | 88.2 | 7.1% | 4.9% | 379 | 0.0% | 0.0% | 4.9% | 25 |
| 8 |

|
Tyler Fitzgerald | 27 | ⚪ D | · | 🌤️ WARM | 215 | 0.111 | 84.5 | 6.4% | 6.3% | 380 | 0.0% | 0.0% | 7.0% | 1 |
| 9 |

|
Jung Hoo Lee | 27 | ⚪ D | · | 🌧️ COOL | 217 | 0.141 | 87.1 | 5.8% | 4.9% | 381 | 0.0% | 0.0% | 5.3% | 32 |