 DET
DET
@
8:05p
 TEX
TEX
Stadium Conditions
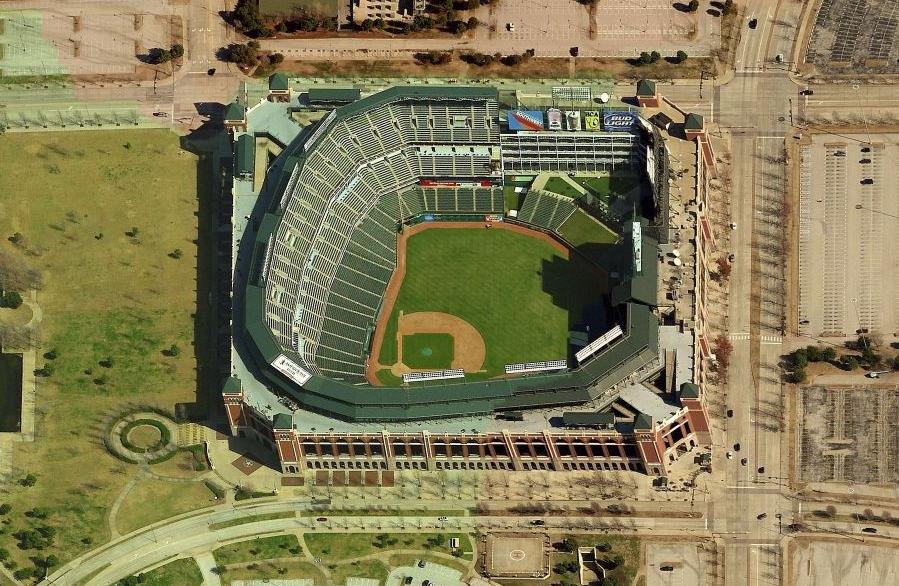
Globe Life Field
First pitch 7:05p
· roof retractable
Park 0.97×
Wind 3 mph out
85°F
retractable
+7
8 mph · out
85°F
7:05p
Boost for HR environment
+7
8 mph · out
85°F
8:05p
Boost for HR environment
+7
8 mph · out
85°F
9:05p
Boost for HR environment
+7
8 mph · out
85°F
10:05p
Boost for HR environment
+7
8 mph · out
85°F
11:05p
Boost for HR environment
⚪ Elevated · Combined 1.07
85°F, wind 3 mph SW (out) — modifier: +1. Park, wind, temperature, and roof are inputs to Combined, not separate signals to stack on top.

9 batters
| # | Batter | Score | Tier | Odds | Form | Rank | ISO ?Isolated Power — career SLG minus AVG. >.220 elite, .180–.220 above avg, <.140 below avg. | EV ?Avg Exit Velocity (mph) — Statcast season-to-date. >92 elite, 89–92 above avg, <86 below avg. | Barrel% ?Barrel rate vs. this pitch mix — percentage of contact classified as barrels (perfect EV + LA combo). >12% elite, 8–12% above avg. | HR/FB ?Batter HR / Fly Ball rate for this matchup. A vs LHP/vs RHP chip means a handedness split is shown; otherwise the value is overall. | HR Dist ?Average distance (ft) of this batter's HRs. >400ft elite raw power, 380–400 above avg. | Sea HR% ?Season HR rate (HRs / PAs so far this year). v3.5 model feature — top backtest contributor. | 14d Pace ?Recent 14-day HR pace (HRs / games started). v3.5 model feature — captures current form. | Match% ?HR/FB Matchup — combined batter × pitcher HR/FB rate. The headline "how favorable is this matchup" number. | BBE ?Sample size — batted-ball events. <30 = small sample, treat stats with caution. | |
|---|---|---|---|---|---|---|---|---|---|---|---|---|---|---|---|---|
| 1 |

|
Dillon Dingler | 62 | 🔵 C+ | +625 | · | 17 | 0.289 | 90.2 | 9.8% | 29.8% vs RHP | 397 | 21.0% | 25.0% | 28.6% | 43 |
| 2 |

|
Kerry Carpenter | 58 | 🟠 C | +475 | · | 20 | 0.253 | 90.9 | 9.4% | 27.7% vs RHP | 380 | 18.2% | 30.0% | 31.3% | 31 |
| 3 |

|
Spencer Torkelson | 52 | 🟠 C | +700 | · | 31 | 0.203 | 90.4 | 10.5% | 24.1% vs RHP | 393 | 15.5% | 8.3% | 21.4% | 30 |
| 4 |

|
Riley Greene | 49 | ⚪ D | +475 | 🌤️ WARM | 46 | 0.165 | 92.0 | 10.3% | 15.5% vs RHP | 397 | 10.6% | 16.7% | 18.2% | 36 |
| 5 |

|
James Outman | 46 | ⚪ D | +850 | 🌤️ WARM | 64 | 0.191 | 86.4 | 6.5% | 23.1% vs RHP | 398 | 13.6% | 22.2% | 23.2% | 17 |
| 6 |

|
Hao-Yu Lee | 41 | ⚪ D | · | 🌧️ COOL | 85 | 0.128 | 87.7 | 8.0% | 9.1% vs RHP | 377 | 20.0% | 20.0% | 8.4% | 29 |
| 7 |

|
Colt Keith | 37 | ⚪ D | +850 | 🌧️ COOL | 100 | 0.122 | 88.6 | 7.3% | 10.0% vs RHP | 372 | 4.2% | 11.1% | 8.0% | 32 |
| 8 |

|
Kevin Mcgonigle | 36 | ⚪ D | +700 | · | 104 | 0.130 | 88.3 | 8.0% | 7.2% vs RHP | 396 | 0.0% | 0.0% | 7.6% | 39 |
| 9 |

|
Zach Mckinstry | 28 | ⚪ D | · | 🌧️ COOL | 138 | 0.093 | 84.1 | 3.8% | 7.3% vs RHP | 386 | 0.0% | 0.0% | 7.6% | 39 |

8 batters
| # | Batter | Score | Tier | Odds | Form | Rank | ISO ?Isolated Power — career SLG minus AVG. >.220 elite, .180–.220 above avg, <.140 below avg. | EV ?Avg Exit Velocity (mph) — Statcast season-to-date. >92 elite, 89–92 above avg, <86 below avg. | Barrel% ?Barrel rate vs. this pitch mix — percentage of contact classified as barrels (perfect EV + LA combo). >12% elite, 8–12% above avg. | HR/FB ?Batter HR / Fly Ball rate for this matchup. A vs LHP/vs RHP chip means a handedness split is shown; otherwise the value is overall. | HR Dist ?Average distance (ft) of this batter's HRs. >400ft elite raw power, 380–400 above avg. | Sea HR% ?Season HR rate (HRs / PAs so far this year). v3.5 model feature — top backtest contributor. | 14d Pace ?Recent 14-day HR pace (HRs / games started). v3.5 model feature — captures current form. | Match% ?HR/FB Matchup — combined batter × pitcher HR/FB rate. The headline "how favorable is this matchup" number. | BBE ?Sample size — batted-ball events. <30 = small sample, treat stats with caution. | |
|---|---|---|---|---|---|---|---|---|---|---|---|---|---|---|---|---|
| 1 |

|
Justin Foscue | 50 | 🟠 C | +750 | 🌧️ COOL | 39 | 0.224 | 89.1 | 8.8% | 50.0% vs LHP | 404 | 16.7% | 33.3% | 31.0% | 14 |
| 2 |

|
Jake Burger | 47 | ⚪ D | +750 | 🌤️ WARM | 58 | 0.189 | 90.3 | 7.9% | 26.7% vs LHP | 396 | 14.1% | 15.4% | 15.6% | 33 |
| 3 |

|
Elias Díaz | 46 | ⚪ D | +675 | 🌧️ COOL | 68 | 0.178 | 85.6 | 7.0% | 42.9% vs LHP | 393 | 22.2% | 16.7% | 13.9% | 22 |
| 4 |

|
Kyle Higashioka | 40 | ⚪ D | +750 | ❄ COLD | 88 | 0.143 | 87.7 | 7.7% | 28.6% vs LHP | 397 | 8.6% | 0.0% | 9.8% | 18 |
| 5 |

|
Josh Jung | 40 | ⚪ D | +950 | 🌤️ WARM | 90 | 0.147 | 90.3 | 6.2% | 16.7% vs LHP | 386 | 11.4% | 7.7% | 8.8% | 38 |
| 6 |

|
Ezequiel Duran | 39 | ⚪ D | +900 | 🌧️ COOL | 94 | 0.144 | 88.8 | 6.0% | 14.3% vs LHP | 377 | 9.1% | 15.4% | 8.4% | 44 |
| 7 |

|
Nicky Lopez | 24 | ⚪ D | · | · | 144 | 0.042 | 85.3 | · | 6.7% | 397 | 4.0% | 0.0% | 6.9% | 37 |
| 8 |

|
Alejandro Osuna | 18 | ⚪ D | · | · | 147 | 0.027 | 87.6 | · | 0.0% | 0 | 0.0% | 0.0% | 6.0% | 37 |