 CWS
CWS
@
6:35p
 BAL
BAL
Stadium Conditions
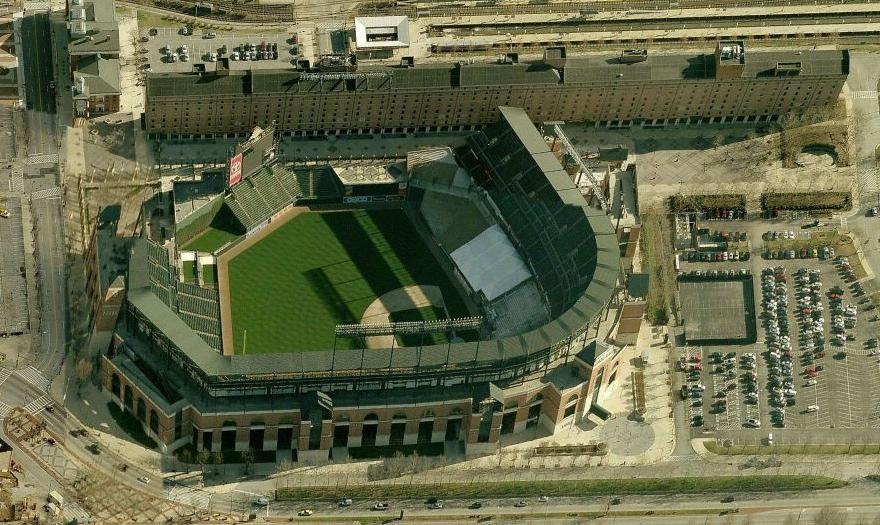
Camden Yards
First pitch 6:35p
· roof open
Park 1.21×
Wind 2 mph slight_out
70°F
open
+5
3 mph · in
85°F
6:35p
Boost for HR environment
+6
3 mph · cross
83°F
7:35p
Boost for HR environment
+6
3 mph · cross
81°F
8:35p
Boost for HR environment
+6
4 mph · cross
79°F
9:35p
Boost for HR environment
+7
5 mph · slight_out
77°F
10:35p
Boost for HR environment
⚪ Boost · Combined 1.21
70°F, wind 2 mph NNW (slight_out) — modifier: +0. Park, wind, temperature, and roof are inputs to Combined, not separate signals to stack on top.

7 batters
| # | Batter | Score | Tier | Odds | Form | Rank | ISO ?Isolated Power — career SLG minus AVG. >.220 elite, .180–.220 above avg, <.140 below avg. | EV ?Avg Exit Velocity (mph) — Statcast season-to-date. >92 elite, 89–92 above avg, <86 below avg. | Barrel% ?Barrel rate vs. this pitch mix — percentage of contact classified as barrels (perfect EV + LA combo). >12% elite, 8–12% above avg. | HR/FB ?Batter HR / Fly Ball rate for this matchup. A vs LHP/vs RHP chip means a handedness split is shown; otherwise the value is overall. | HR Dist ?Average distance (ft) of this batter's HRs. >400ft elite raw power, 380–400 above avg. | Sea HR% ?Season HR rate (HRs / PAs so far this year). v3.5 model feature — top backtest contributor. | 14d Pace ?Recent 14-day HR pace (HRs / games started). v3.5 model feature — captures current form. | Match% ?HR/FB Matchup — combined batter × pitcher HR/FB rate. The headline "how favorable is this matchup" number. | BBE ?Sample size — batted-ball events. <30 = small sample, treat stats with caution. | |
|---|---|---|---|---|---|---|---|---|---|---|---|---|---|---|---|---|
| 1 |

|
Colson Montgomery | 66 | 🔵 C+ | +255 | 🌧️ COOL | 11 | 0.251 | 89.7 | 10.7% | 26.0% vs RHP | 396 | 25.8% | 16.7% | 33.0% | 24 |
| 2 |

|
Miguel Vargas ⚡ | 65 | 🔵 C+ | +330 | 🌤️ WARM | 16 | 0.230 | 90.0 | 10.6% | 16.1% vs RHP | 389 | 23.1% | 27.3% | 28.2% | 34 |
| 3 |

|
Andrew Benintendi | 58 | 🟠 C | +400 | 🌤️ WARM | 34 | 0.196 | 89.7 | 9.3% | 20.0% vs RHP | 391 | 17.0% | 25.0% | 24.7% | 25 |
| 4 |

|
Tristan Peters | 46 | ⚪ D | +625 | 🌧️ COOL | 98 | 0.165 | 86.7 | 6.2% | 9.8% vs RHP | 369 | 7.1% | 10.0% | 10.7% | 27 |
| 5 |

|
Sam Antonacci | 45 | ⚪ D | +750 | · | 101 | 0.123 | 87.8 | 7.6% | 12.5% vs RHP | 410 | 7.3% | 18.2% | 10.0% | 36 |
| 6 |

|
Chase Meidroth | 40 | ⚪ D | +850 | ❄ COLD | 134 | 0.114 | 87.5 | 6.0% | 12.5% vs RHP | 381 | 6.1% | 0.0% | 9.1% | 27 |
| 7 |

|
Luisangel Acuna | 35 | ⚪ D | · | 🌧️ COOL | 165 | 0.035 | 89.3 | 5.9% | 8.3% vs RHP | 416 | 0.0% | 0.0% | 10.7% | 16 |

8 batters
| # | Batter | Score | Tier | Odds | Form | Rank | ISO ?Isolated Power — career SLG minus AVG. >.220 elite, .180–.220 above avg, <.140 below avg. | EV ?Avg Exit Velocity (mph) — Statcast season-to-date. >92 elite, 89–92 above avg, <86 below avg. | Barrel% ?Barrel rate vs. this pitch mix — percentage of contact classified as barrels (perfect EV + LA combo). >12% elite, 8–12% above avg. | HR/FB ?Batter HR / Fly Ball rate for this matchup. A vs LHP/vs RHP chip means a handedness split is shown; otherwise the value is overall. | HR Dist ?Average distance (ft) of this batter's HRs. >400ft elite raw power, 380–400 above avg. | Sea HR% ?Season HR rate (HRs / PAs so far this year). v3.5 model feature — top backtest contributor. | 14d Pace ?Recent 14-day HR pace (HRs / games started). v3.5 model feature — captures current form. | Match% ?HR/FB Matchup — combined batter × pitcher HR/FB rate. The headline "how favorable is this matchup" number. | BBE ?Sample size — batted-ball events. <30 = small sample, treat stats with caution. | |
|---|---|---|---|---|---|---|---|---|---|---|---|---|---|---|---|---|
| 1 |

|
Pete Alonso | 65 | 🔵 C+ | +280 | 🌧️ COOL | 15 | 0.217 | 94.2 | 9.7% | 30.0% vs RHP | 397 | 20.5% | 25.0% | 32.5% | 24 |
| 2 |

|
Samuel Basallo | 57 | 🟠 C | +350 | ❄ COLD | 39 | 0.201 | 91.3 | 9.4% | 26.8% vs RHP | 401 | 13.6% | 9.1% | 23.0% | 30 |
| 3 |

|
Gunnar Henderson | 56 | 🟠 C | +330 | 🌧️ COOL | 44 | 0.198 | 89.5 | 7.8% | 17.9% vs RHP | 388 | 18.5% | 16.7% | 15.7% | 39 |
| 4 |

|
Coby Mayo | 54 | 🟠 C | +390 | 🌤️ WARM | 49 | 0.183 | 91.9 | 8.6% | 12.0% vs RHP | 403 | 14.7% | 9.1% | 15.6% | 17 |
| 5 |

|
Colton Cowser | 53 | 🟠 C | +475 | 🌧️ COOL | 56 | 0.165 | 86.0 | 9.3% | 24.2% vs RHP | 417 | 17.5% | 12.5% | 13.6% | 22 |
| 6 |

|
Adley Rutschman | 52 | 🟠 C | +425 | ❄ COLD | 59 | 0.198 | 89.4 | 8.1% | 15.6% vs RHP | 400 | 11.6% | 0.0% | 14.7% | 13 |
| 7 |

|
Taylor Ward | 42 | ⚪ D | +475 | 🌤️ WARM | 116 | 0.104 | 89.4 | 6.2% | 6.5% vs RHP | 393 | 6.0% | 16.7% | 9.4% | 37 |
| 8 |

|
Leody Taveras | 40 | ⚪ D | · | · | 135 | 0.124 | 87.3 | 5.5% | 9.4% vs RHP | 409 | 0.0% | 0.0% | 8.9% | 24 |