 WSH
WSH
@
3:45p
 SF
SF
Stadium Conditions
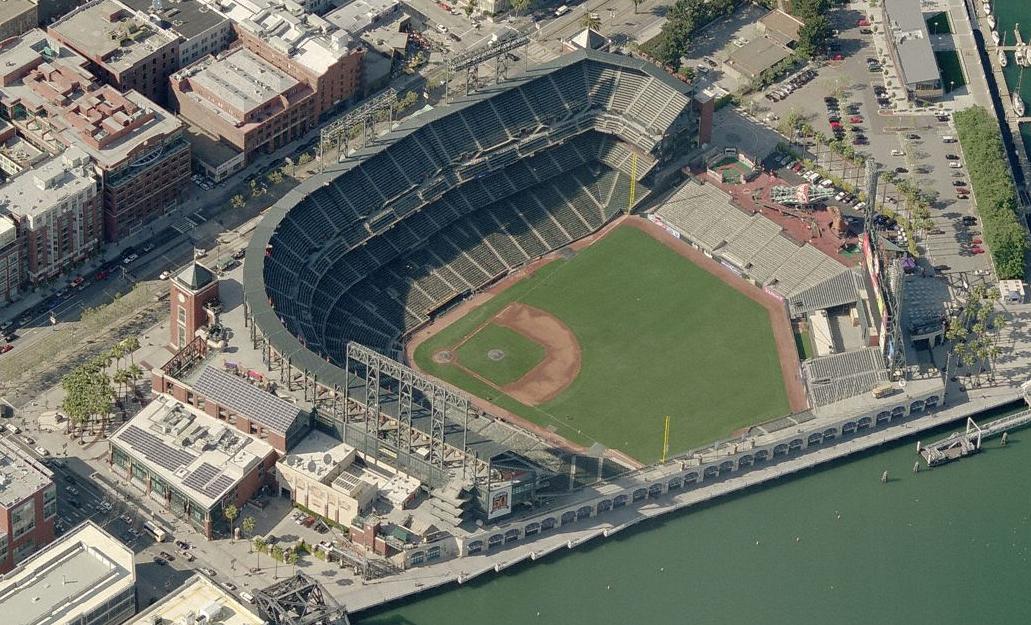
Oracle Park
First pitch 3:45p
· roof open
Park 0.85×
Wind 11 mph out
75°F
open
+5
15 mph · slight_out
64°F
3:45p
Boost for HR environment
+5
15 mph · slight_out
64°F
4:45p
Boost for HR environment
+5
15 mph · slight_out
64°F
5:45p
Boost for HR environment
+5
15 mph · slight_out
64°F
6:45p
Boost for HR environment
+5
15 mph · slight_out
64°F
7:45p
Boost for HR environment
⚪ Boost · Combined 1.20
75°F, wind 11 mph SSW (out) — modifier: +4. Park, wind, temperature, and roof are inputs to Combined, not separate signals to stack on top.

9 batters
| # | Batter | Score | Tier | Odds | Form | Rank | ISO ?Isolated Power — career SLG minus AVG. >.220 elite, .180–.220 above avg, <.140 below avg. | EV ?Avg Exit Velocity (mph) — Statcast season-to-date. >92 elite, 89–92 above avg, <86 below avg. | Barrel% ?Barrel rate vs. this pitch mix — percentage of contact classified as barrels (perfect EV + LA combo). >12% elite, 8–12% above avg. | HR/FB ?Batter HR / Fly Ball rate for this matchup. A vs LHP/vs RHP chip means a handedness split is shown; otherwise the value is overall. | HR Dist ?Average distance (ft) of this batter's HRs. >400ft elite raw power, 380–400 above avg. | Sea HR% ?Season HR rate (HRs / PAs so far this year). v3.5 model feature — top backtest contributor. | 14d Pace ?Recent 14-day HR pace (HRs / games started). v3.5 model feature — captures current form. | Match% ?HR/FB Matchup — combined batter × pitcher HR/FB rate. The headline "how favorable is this matchup" number. | BBE ?Sample size — batted-ball events. <30 = small sample, treat stats with caution. | |
|---|---|---|---|---|---|---|---|---|---|---|---|---|---|---|---|---|
| 1 |

|
James Wood | 72 | 🟡 B | · | 🌧️ COOL | 13 | 0.247 | 96.0 | 16.9% | 30.8% vs LHP | 408 | 26.5% | 16.7% | 21.0% | 26 |
| 2 |

|
Curtis Mead | 59 | 🟠 C | · | · | 45 | 0.233 | 89.4 | 10.7% | 15.8% vs LHP | 398 | 16.7% | 20.0% | 18.0% | 30 |
| 3 |

|
Keibert Ruiz | 52 | 🟠 C | · | ❄ COLD | 71 | 0.209 | 90.0 | 8.3% | 22.2% vs LHP | 372 | 17.6% | 14.3% | 13.0% | 22 |
| 4 |

|
Dylan Crews | 44 | ⚪ D | · | 🌤️ WARM | 110 | 0.107 | 91.9 | 10.5% | 20.0% vs LHP | 414 | 18.2% | 16.7% | 7.9% | 25 |
| 5 |

|
Daylen Lile | 44 | ⚪ D | · | · | 113 | 0.161 | 88.0 | 9.7% | 0.0% vs LHP | 403 | 10.4% | 8.3% | 5.7% | 39 |
| 6 |

|
Jacob Young | 42 | ⚪ D | · | 🌤️ WARM | 124 | 0.151 | 89.2 | 8.6% | 6.7% vs LHP | 391 | 11.4% | 9.1% | 7.5% | 22 |
| 7 |

|
Andres Chaparro | 30 | ⚪ D | · | 🌧️ COOL | 192 | 0.097 | 87.4 | 8.0% | 0.0% vs LHP | 0 | 0.0% | 0.0% | 7.2% | 3 |
| 8 |

|
Jorbit Vivas ⚡ | 27 | ⚪ D | · | 🌤️ WARM | 207 | 0.089 | 83.5 | 6.6% | 3.0% | 364 | 2.8% | 0.0% | 5.0% | 21 |
| 9 |

|
Nasim Nunez | 10 | ⚪ D | · | · | 231 | 0.021 | 84.8 | · | 0.0% vs LHP | 0 | 0.0% | 0.0% | 5.7% | 18 |

6 batters
| # | Batter | Score | Tier | Odds | Form | Rank | ISO ?Isolated Power — career SLG minus AVG. >.220 elite, .180–.220 above avg, <.140 below avg. | EV ?Avg Exit Velocity (mph) — Statcast season-to-date. >92 elite, 89–92 above avg, <86 below avg. | Barrel% ?Barrel rate vs. this pitch mix — percentage of contact classified as barrels (perfect EV + LA combo). >12% elite, 8–12% above avg. | HR/FB ?Batter HR / Fly Ball rate for this matchup. A vs LHP/vs RHP chip means a handedness split is shown; otherwise the value is overall. | HR Dist ?Average distance (ft) of this batter's HRs. >400ft elite raw power, 380–400 above avg. | Sea HR% ?Season HR rate (HRs / PAs so far this year). v3.5 model feature — top backtest contributor. | 14d Pace ?Recent 14-day HR pace (HRs / games started). v3.5 model feature — captures current form. | Match% ?HR/FB Matchup — combined batter × pitcher HR/FB rate. The headline "how favorable is this matchup" number. | BBE ?Sample size — batted-ball events. <30 = small sample, treat stats with caution. | |
|---|---|---|---|---|---|---|---|---|---|---|---|---|---|---|---|---|
| 1 |

|
Casey Schmitt | 61 | 🔵 C+ | · | 🌧️ COOL | 36 | 0.247 | 89.4 | 12.3% | 16.7% vs LHP | 393 | 19.4% | 15.4% | 17.6% | 51 |
| 2 |

|
Bryce Eldridge | 50 | 🟠 C | · | 🌤️ WARM | 79 | 0.161 | 92.7 | 10.9% | 8.3% | 407 | 16.7% | 22.2% | 8.4% | 37 |
| 3 |

|
Rafael Devers | 47 | ⚪ D | · | · | 97 | 0.174 | 91.8 | 10.8% | 12.5% vs LHP | 400 | 11.5% | 7.7% | 8.9% | 33 |
| 4 |

|
Matt Chapman | 37 | ⚪ D | · | 🌤️ WARM | 155 | 0.137 | 87.9 | 7.8% | 12.5% vs LHP | 389 | 4.8% | 15.4% | 11.3% | 42 |
| 5 |

|
Jung Hoo Lee | 30 | ⚪ D | · | 🌤️ WARM | 190 | 0.130 | 87.7 | 5.3% | 8.3% vs LHP | 363 | 5.4% | 0.0% | 6.3% | 49 |
| 6 |

|
Daniel Susac | 26 | ⚪ D | · | ❄ COLD | 212 | 0.077 | 87.2 | 7.6% | 0.0% | 0 | 0.0% | 0.0% | 6.0% | 24 |