 TB
TB
@
10:10p
 LAD
LAD
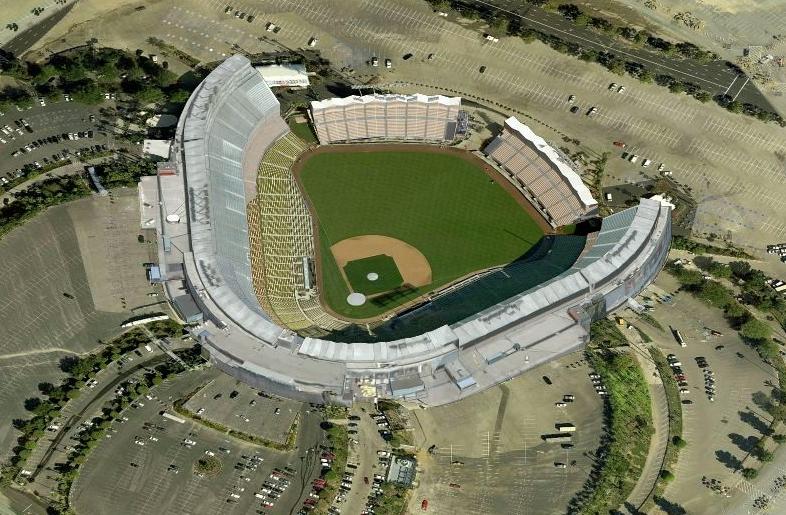
Stadium Conditions
Dodger Stadium
First pitch 10:10p
· roof open
Park 1.29×
Wind 1 mph out
81°F
open
+17
8 mph · out
81°F
10:10p
Strong boost for HR environment
+17
8 mph · out
81°F
11:10p
Strong boost for HR environment
+17
8 mph · out
81°F
12:10a
Strong boost for HR environment
+17
8 mph · out
81°F
1:10a
Strong boost for HR environment
+17
8 mph · out
81°F
2:10a
Strong boost for HR environment
⚪ Boost · Combined 1.42
81°F, wind 1 mph SSW (out) — modifier: +1. Park, wind, temperature, and roof are inputs to Combined, not separate signals to stack on top.

7 batters
| # | Batter | Score | Tier | Odds | Form | Rank | ISO ?Isolated Power — career SLG minus AVG. >.220 elite, .180–.220 above avg, <.140 below avg. | EV ?Avg Exit Velocity (mph) — Statcast season-to-date. >92 elite, 89–92 above avg, <86 below avg. | Barrel% ?Barrel rate vs. this pitch mix — percentage of contact classified as barrels (perfect EV + LA combo). >12% elite, 8–12% above avg. | HR/FB ?Batter HR / Fly Ball rate for this matchup. A vs LHP/vs RHP chip means a handedness split is shown; otherwise the value is overall. | HR Dist ?Average distance (ft) of this batter's HRs. >400ft elite raw power, 380–400 above avg. | Sea HR% ?Season HR rate (HRs / PAs so far this year). v3.5 model feature — top backtest contributor. | 14d Pace ?Recent 14-day HR pace (HRs / games started). v3.5 model feature — captures current form. | Match% ?HR/FB Matchup — combined batter × pitcher HR/FB rate. The headline "how favorable is this matchup" number. | BBE ?Sample size — batted-ball events. <30 = small sample, treat stats with caution. | |
|---|---|---|---|---|---|---|---|---|---|---|---|---|---|---|---|---|
| 1 |

|
Shohei Ohtani | 74 | 🟡 B | +192 | 🌤️ WARM | 7 | 0.246 | 93.8 | 10.7% | 21.9% vs RHP | 401 | 16.4% | 33.3% | 31.9% | 30 |
| 2 |

|
Max Muncy | 73 | 🟡 B | +280 | · | 8 | 0.264 | 90.6 | 10.6% | 28.6% vs RHP | 408 | 19.6% | 20.0% | 25.7% | 48 |
| 3 |

|
Andy Pages | 62 | 🔵 C+ | +330 | 🌧️ COOL | 26 | 0.221 | 89.9 | 8.0% | 27.9% vs RHP | 390 | 17.6% | 16.7% | 21.0% | 41 |
| 4 |

|
Freddie Freeman | 60 | 🔵 C+ | +370 | 🌧️ COOL | 32 | 0.187 | 90.8 | 9.0% | 17.0% vs RHP | 392 | 13.4% | 23.1% | 19.2% | 43 |
| 5 |

|
Mookie Betts | 49 | ⚪ D | +400 | · | 68 | 0.147 | 90.0 | 7.9% | 11.8% vs RHP | 385 | 6.9% | 12.5% | 11.5% | 43 |
| 6 |

|
Kyle Tucker | 43 | ⚪ D | +425 | 🌧️ COOL | 88 | 0.135 | 88.8 | 5.9% | 8.9% vs RHP | 403 | 4.4% | 7.7% | 8.7% | 30 |
| 7 |

|
Alex Freeland ⚡ | 41 | ⚪ D | +625 | 🌧️ COOL | 99 | 0.118 | 89.6 | 6.9% | 11.1% vs RHP | 373 | 4.2% | 0.0% | 8.8% | 24 |

9 batters
| # | Batter | Score | Tier | Odds | Form | Rank | ISO ?Isolated Power — career SLG minus AVG. >.220 elite, .180–.220 above avg, <.140 below avg. | EV ?Avg Exit Velocity (mph) — Statcast season-to-date. >92 elite, 89–92 above avg, <86 below avg. | Barrel% ?Barrel rate vs. this pitch mix — percentage of contact classified as barrels (perfect EV + LA combo). >12% elite, 8–12% above avg. | HR/FB ?Batter HR / Fly Ball rate for this matchup. A vs LHP/vs RHP chip means a handedness split is shown; otherwise the value is overall. | HR Dist ?Average distance (ft) of this batter's HRs. >400ft elite raw power, 380–400 above avg. | Sea HR% ?Season HR rate (HRs / PAs so far this year). v3.5 model feature — top backtest contributor. | 14d Pace ?Recent 14-day HR pace (HRs / games started). v3.5 model feature — captures current form. | Match% ?HR/FB Matchup — combined batter × pitcher HR/FB rate. The headline "how favorable is this matchup" number. | BBE ?Sample size — batted-ball events. <30 = small sample, treat stats with caution. | |
|---|---|---|---|---|---|---|---|---|---|---|---|---|---|---|---|---|
| 1 |

|
Junior Caminero ⚡ | 72 | 🟡 B | +210 | · | 12 | 0.203 | 92.8 | 11.6% | 37.5% vs LHP | 406 | 21.5% | 16.7% | 26.3% | 33 |
| 2 |

|
Jonathan Aranda | 63 | 🔵 C+ | +400 | ❄ COLD | 24 | 0.183 | 90.8 | 11.7% | 9.1% vs LHP | 396 | 14.3% | 0.0% | 17.4% | 30 |
| 3 |

|
Yandy Diaz ⚡ | 57 | 🟠 C | +330 | 🌧️ COOL | 35 | 0.192 | 90.6 | 9.6% | 21.1% vs LHP | 385 | 0.0% | 0.0% | 17.2% | 43 |
| 4 |

|
Cedric Mullins | 51 | 🟠 C | +625 | 🌤️ WARM | 56 | 0.115 | 88.4 | 6.3% | 0.0% vs LHP | 386 | 9.4% | 27.3% | 17.7% | 23 |
| 5 |

|
Ben Williamson | 38 | ⚪ D | +950 | 🌤️ WARM | 108 | 0.078 | 88.5 | 4.4% | 10.0% vs LHP | 394 | 1.9% | 11.1% | 10.1% | 25 |
| 6 |

|
Richie Palacios | 37 | ⚪ D | · | ❄ COLD | 113 | 0.076 | 87.2 | 5.6% | 3.0% | 382 | 0.0% | 0.0% | 11.2% | 28 |
| 7 |

|
Taylor Walls | 35 | ⚪ D | +850 | 🌤️ WARM | 118 | 0.066 | 83.1 | 5.5% | 0.0% vs LHP | 0 | 0.0% | 0.0% | 8.4% | 16 |
| 8 |

|
Nick Fortes | 34 | ⚪ D | +750 | 🌤️ WARM | 121 | 0.078 | 86.6 | 4.0% | 0.0% vs LHP | 408 | 0.0% | 0.0% | 8.4% | 24 |
| 9 |

|
Chandler Simpson | 26 | ⚪ D | · | 🌧️ COOL | 141 | 0.059 | 83.9 | · | 0.0% vs LHP | 0 | 0.0% | 0.0% | 10.5% | 23 |