 NYY
NYY
@
1:37p
 TOR
TOR
Stadium Conditions
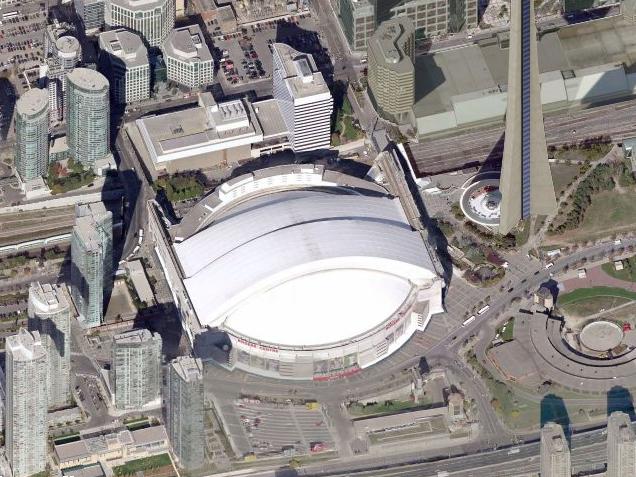
Rogers Centre
First pitch 1:37p
· roof unknown
Park 1.12×
Wind 0 mph dome
—
unknown
Hourly forecast unavailable; showing current stadium conditions only.
⚪ Boost · Combined 1.12
Dome — weather irrelevant. Park, wind, temperature, and roof are inputs to Combined, not separate signals to stack on top.

8 batters
| # | Batter | Score | Tier | Odds | Form | Rank | ISO ?Isolated Power — career SLG minus AVG. >.220 elite, .180–.220 above avg, <.140 below avg. | EV ?Avg Exit Velocity (mph) — Statcast season-to-date. >92 elite, 89–92 above avg, <86 below avg. | Barrel% ?Barrel rate vs. this pitch mix — percentage of contact classified as barrels (perfect EV + LA combo). >12% elite, 8–12% above avg. | HR/FB ?Batter HR / Fly Ball rate for this matchup. A vs LHP/vs RHP chip means a handedness split is shown; otherwise the value is overall. | HR Dist ?Average distance (ft) of this batter's HRs. >400ft elite raw power, 380–400 above avg. | Sea HR% ?Season HR rate (HRs / PAs so far this year). v3.5 model feature — top backtest contributor. | 14d Pace ?Recent 14-day HR pace (HRs / games started). v3.5 model feature — captures current form. | Match% ?HR/FB Matchup — combined batter × pitcher HR/FB rate. The headline "how favorable is this matchup" number. | BBE ?Sample size — batted-ball events. <30 = small sample, treat stats with caution. | |
|---|---|---|---|---|---|---|---|---|---|---|---|---|---|---|---|---|
| 1 |

|
Ben Rice | 75 | 🟡 B | · | ❄ COLD | 11 | 0.318 | 92.1 | 10.9% | 55.6% vs LHP | 390 | 23.0% | 8.3% | 18.5% | 31 |
| 2 |

|
Paul Goldschmidt | 67 | 🔵 C+ | · | 🌧️ COOL | 23 | 0.224 | 87.4 | 9.6% | 38.5% vs LHP | 393 | 14.7% | 25.0% | 33.7% | 38 |
| 3 |

|
Amed Rosario | 58 | 🟠 C | · | ❄ COLD | 55 | 0.214 | 90.3 | 9.5% | 18.8% vs LHP | 403 | 8.3% | 0.0% | 16.5% | 8 |
| 4 |

|
Cody Bellinger | 57 | 🟠 C | · | 🌧️ COOL | 58 | 0.196 | 89.3 | 8.2% | 14.3% vs LHP | 381 | 12.9% | 16.7% | 10.5% | 39 |
| 5 |

|
Jasson Dominguez ⚡ | 54 | 🟠 C | · | 🌧️ COOL | 63 | 0.257 | 91.9 | 4.8% | 22.2% | 353 | 0.0% | 0.0% | 17.4% | 3 |
| 6 |

|
Max Schuemann | 52 | 🟠 C | · | 🌤️ WARM | 74 | 0.222 | 87.1 | 6.7% | 14.3% | 0 | 0.0% | 0.0% | 20.2% | 4 |
| 7 |

|
Jose Caballero | 38 | ⚪ D | · | 🌧️ COOL | 161 | 0.129 | 83.2 | 4.7% | 30.0% vs LHP | 365 | 0.0% | 0.0% | 11.5% | 23 |
| 8 |

|
Anthony Volpe | 37 | ⚪ D | · | 🌧️ COOL | 168 | 0.105 | 85.5 | 5.7% | 14.3% vs LHP | 409 | 3.6% | 0.0% | 9.6% | 23 |

7 batters
| # | Batter | Score | Tier | Odds | Form | Rank | ISO ?Isolated Power — career SLG minus AVG. >.220 elite, .180–.220 above avg, <.140 below avg. | EV ?Avg Exit Velocity (mph) — Statcast season-to-date. >92 elite, 89–92 above avg, <86 below avg. | Barrel% ?Barrel rate vs. this pitch mix — percentage of contact classified as barrels (perfect EV + LA combo). >12% elite, 8–12% above avg. | HR/FB ?Batter HR / Fly Ball rate for this matchup. A vs LHP/vs RHP chip means a handedness split is shown; otherwise the value is overall. | HR Dist ?Average distance (ft) of this batter's HRs. >400ft elite raw power, 380–400 above avg. | Sea HR% ?Season HR rate (HRs / PAs so far this year). v3.5 model feature — top backtest contributor. | 14d Pace ?Recent 14-day HR pace (HRs / games started). v3.5 model feature — captures current form. | Match% ?HR/FB Matchup — combined batter × pitcher HR/FB rate. The headline "how favorable is this matchup" number. | BBE ?Sample size — batted-ball events. <30 = small sample, treat stats with caution. | |
|---|---|---|---|---|---|---|---|---|---|---|---|---|---|---|---|---|
| 1 |

|
Kazuma Okamoto | 61 | 🔵 C+ | · | 🌧️ COOL | 39 | 0.197 | 92.4 | 10.1% | 29.7% vs RHP | 402 | 17.6% | 25.0% | 24.9% | 27 |
| 2 |

|
Alejandro Kirk | 58 | 🟠 C | · | 🌤️ WARM | 53 | 0.311 | 86.9 | 5.8% | 33.3% | 394 | 7.7% | 0.0% | 23.7% | 3 |
| 3 |

|
Jesús Sánchez | 54 | 🟠 C | · | 🌤️ WARM | 68 | 0.194 | 91.4 | 9.0% | 22.9% vs RHP | 398 | 12.2% | 14.3% | 14.7% | 23 |
| 4 |

|
George Springer | 46 | ⚪ D | · | · | 107 | 0.165 | 87.7 | 7.5% | 20.8% vs RHP | 387 | 8.3% | 11.1% | 11.2% | 24 |
| 5 |

|
Ernie Clement | 41 | ⚪ D | · | 🌧️ COOL | 145 | 0.156 | 85.3 | 4.4% | 9.1% vs RHP | 374 | 10.4% | 16.7% | 9.0% | 41 |
| 6 |

|
Davis Schneider | 33 | ⚪ D | · | 🌤️ WARM | 180 | 0.076 | 86.8 | 8.0% | 12.5% vs RHP | 366 | 0.0% | 0.0% | 10.0% | 2 |
| 7 |

|
Nathan Lukes | 27 | ⚪ D | · | ❄ COLD | 215 | 0.078 | 86.3 | 2.8% | 6.2% vs RHP | 374 | 2.0% | 9.1% | 7.8% | 35 |