 MIN
MIN
@
6:40p
 DET
DET
Stadium Conditions
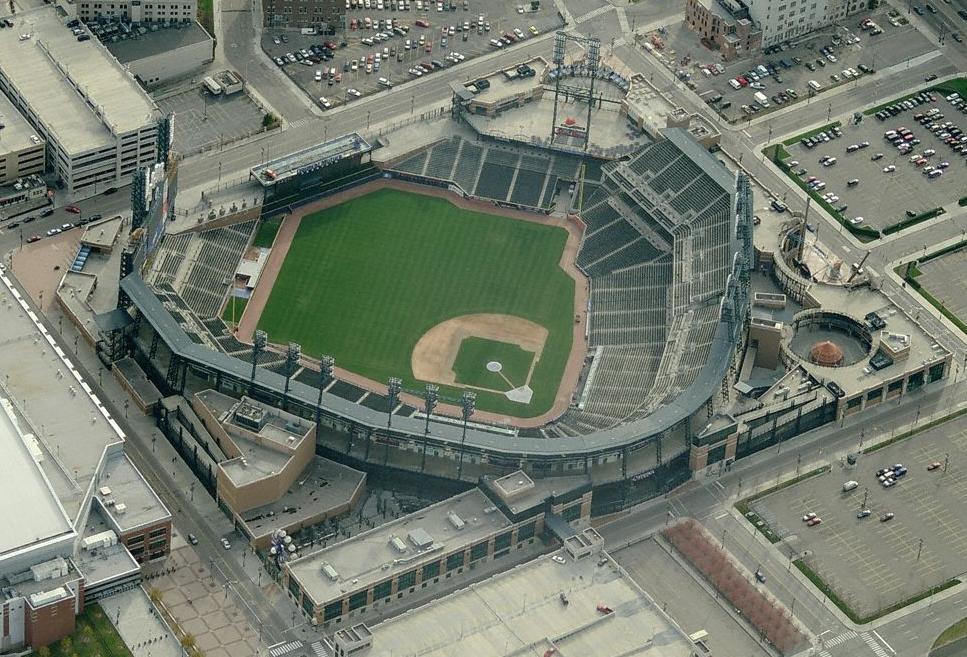
Comerica Park
First pitch 6:40p
· roof open
Park 0.90×
Wind 2 mph in
76°F
open
+0
8 mph · slight_out
74°F
6:40p
Neutral for HR environment
+0
8 mph · slight_out
74°F
7:40p
Neutral for HR environment
+0
8 mph · slight_out
74°F
8:40p
Neutral for HR environment
+0
8 mph · slight_out
74°F
9:40p
Neutral for HR environment
+0
8 mph · slight_out
74°F
10:40p
Neutral for HR environment
⚪ Soft suppress · Combined 0.90
76°F, wind 2 mph ESE (in) — modifier: +0. Park, wind, temperature, and roof are inputs to Combined, not separate signals to stack on top.

9 batters
| # | Batter | Score | Tier | Odds | Form | Rank | ISO ?Isolated Power — career SLG minus AVG. >.220 elite, .180–.220 above avg, <.140 below avg. | EV ?Avg Exit Velocity (mph) — Statcast season-to-date. >92 elite, 89–92 above avg, <86 below avg. | Barrel% ?Barrel rate vs. this pitch mix — percentage of contact classified as barrels (perfect EV + LA combo). >12% elite, 8–12% above avg. | HR/FB ?Batter HR / Fly Ball rate for this matchup. A vs LHP/vs RHP chip means a handedness split is shown; otherwise the value is overall. | HR Dist ?Average distance (ft) of this batter's HRs. >400ft elite raw power, 380–400 above avg. | Sea HR% ?Season HR rate (HRs / PAs so far this year). v3.5 model feature — top backtest contributor. | 14d Pace ?Recent 14-day HR pace (HRs / games started). v3.5 model feature — captures current form. | Match% ?HR/FB Matchup — combined batter × pitcher HR/FB rate. The headline "how favorable is this matchup" number. | BBE ?Sample size — batted-ball events. <30 = small sample, treat stats with caution. | |
|---|---|---|---|---|---|---|---|---|---|---|---|---|---|---|---|---|
| 1 |

|
Dillon Dingler | 62 | 🔵 C+ | +900 | · | 26 | 0.287 | 90.5 | 11.0% | 31.7% vs RHP | 397 | 21.7% | 27.3% | 25.9% | 35 |
| 2 |

|
Kerry Carpenter | 54 | 🟠 C | +480 | 🌧️ COOL | 53 | 0.237 | 91.0 | 9.5% | 26.7% vs RHP | 379 | 14.6% | 33.3% | 24.9% | 14 |
| 3 |

|
Spencer Torkelson ⚡ | 46 | ⚪ D | +550 | 🌤️ WARM | 102 | 0.180 | 90.6 | 10.9% | 18.2% vs RHP | 396 | 14.3% | 16.7% | 14.1% | 28 |
| 4 |

|
Riley Greene | 39 | ⚪ D | +575 | 🌤️ WARM | 148 | 0.147 | 91.1 | 10.3% | 10.5% vs RHP | 399 | 7.8% | 16.7% | 9.7% | 31 |
| 5 |

|
Matt Vierling | 30 | ⚪ D | · | · | 196 | 0.144 | 86.9 | 7.1% | 12.0% vs RHP | 370 | 8.6% | 0.0% | 7.2% | 27 |
| 6 |

|
Gleyber Torres | 29 | ⚪ D | · | 🌤️ WARM | 199 | 0.103 | 84.6 | 7.5% | 8.3% vs RHP | 395 | 6.1% | 20.0% | 8.9% | 14 |
| 7 |

|
Kevin Mcgonigle | 28 | ⚪ D | +900 | · | 203 | 0.129 | 88.0 | 8.8% | 5.6% vs RHP | 407 | 0.0% | 0.0% | 6.1% | 36 |
| 8 |

|
Colt Keith | 18 | ⚪ D | +1000 | ❄ COLD | 226 | 0.071 | 88.2 | 6.1% | 0.0% vs RHP | 0 | 0.0% | 0.0% | 5.5% | 24 |
| 9 |

|
Zach Mckinstry ⚡ | 12 | ⚪ D | · | 🌤️ WARM | 230 | 0.046 | 84.6 | 4.2% | 3.7% vs RHP | 399 | 0.0% | 0.0% | 5.9% | 21 |

8 batters
| # | Batter | Score | Tier | Odds | Form | Rank | ISO ?Isolated Power — career SLG minus AVG. >.220 elite, .180–.220 above avg, <.140 below avg. | EV ?Avg Exit Velocity (mph) — Statcast season-to-date. >92 elite, 89–92 above avg, <86 below avg. | Barrel% ?Barrel rate vs. this pitch mix — percentage of contact classified as barrels (perfect EV + LA combo). >12% elite, 8–12% above avg. | HR/FB ?Batter HR / Fly Ball rate for this matchup. A vs LHP/vs RHP chip means a handedness split is shown; otherwise the value is overall. | HR Dist ?Average distance (ft) of this batter's HRs. >400ft elite raw power, 380–400 above avg. | Sea HR% ?Season HR rate (HRs / PAs so far this year). v3.5 model feature — top backtest contributor. | 14d Pace ?Recent 14-day HR pace (HRs / games started). v3.5 model feature — captures current form. | Match% ?HR/FB Matchup — combined batter × pitcher HR/FB rate. The headline "how favorable is this matchup" number. | BBE ?Sample size — batted-ball events. <30 = small sample, treat stats with caution. | |
|---|---|---|---|---|---|---|---|---|---|---|---|---|---|---|---|---|
| 1 |

|
Byron Buxton | 60 | 🔵 C+ | +800 | 🌧️ COOL | 33 | 0.309 | 90.2 | 9.2% | 35.4% vs RHP | 398 | 30.2% | 22.2% | 19.8% | 26 |
| 2 |

|
Kody Clemens | 48 | ⚪ D | · | · | 91 | 0.231 | 92.6 | 8.2% | 16.2% vs RHP | 396 | 8.0% | 18.2% | 19.4% | 37 |
| 3 |

|
Brooks Lee | 36 | ⚪ D | · | · | 165 | 0.171 | 87.6 | 5.0% | 19.4% vs RHP | 371 | 13.8% | 18.2% | 13.4% | 40 |
| 4 |

|
Tristan Gray | 31 | ⚪ D | · | 🌧️ COOL | 190 | 0.134 | 89.9 | 6.0% | 18.8% vs RHP | 389 | 11.8% | 11.1% | 6.9% | 28 |
| 5 |

|
Josh Bell | 29 | ⚪ D | · | · | 200 | 0.125 | 90.0 | 6.8% | 16.7% vs RHP | 405 | 4.5% | 10.0% | 6.6% | 29 |
| 6 |

|
Royce Lewis | 28 | ⚪ D | +1000 | ❄ COLD | 205 | 0.105 | 87.6 | 7.1% | 21.4% vs RHP | 382 | 12.0% | 0.0% | 7.4% | 6 |
| 7 |

|
Trevor Larnach | 25 | ⚪ D | · | · | 213 | 0.137 | 86.3 | 5.1% | 10.3% vs RHP | 395 | 3.8% | 0.0% | 6.3% | 26 |
| 8 |

|
Luke Keaschall | 16 | ⚪ D | · | 🌧️ COOL | 227 | 0.078 | 84.1 | 3.6% | 5.9% vs RHP | 367 | 1.9% | 0.0% | 4.7% | 36 |