 CWS
CWS
@
1:10p
 DET
DET
Stadium Conditions
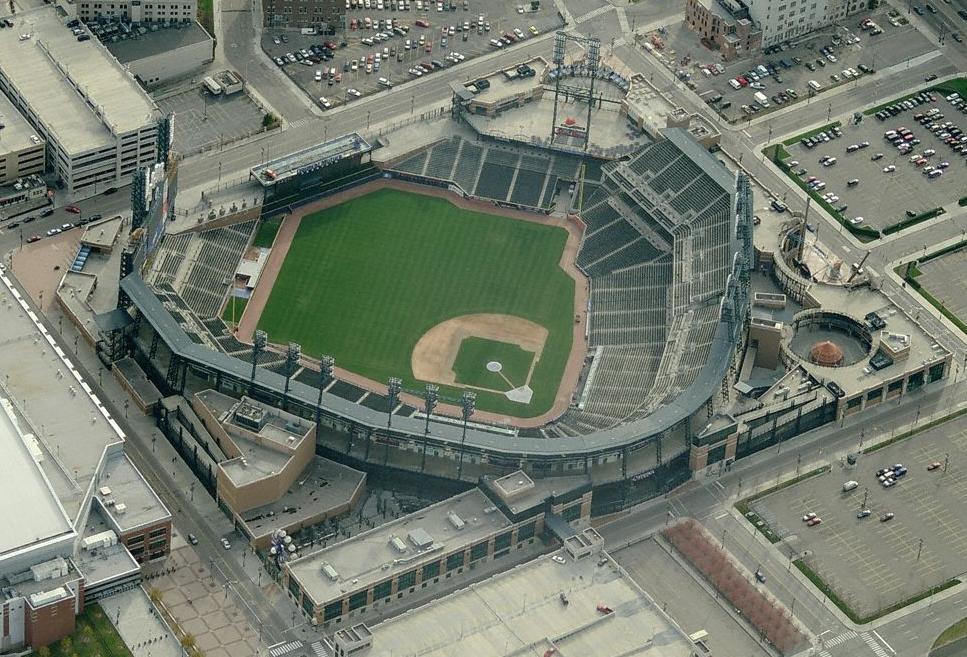
Comerica Park
First pitch 1:10p
· roof open
Park 1.05×
Wind 3 mph out
74°F
open
+5
8 mph · slight_out
74°F
1:10p
Boost for HR environment
+5
8 mph · slight_out
74°F
2:10p
Boost for HR environment
+5
8 mph · slight_out
74°F
3:10p
Boost for HR environment
+5
8 mph · slight_out
74°F
4:10p
Boost for HR environment
+5
8 mph · slight_out
74°F
5:10p
Boost for HR environment
⚪ Elevated · Combined 1.05
74°F, wind 3 mph NW (out) — modifier: +0. Park, wind, temperature, and roof are inputs to Combined, not separate signals to stack on top.

8 batters
| # | Batter | Score | Tier | Odds | Form | Rank | ISO ?Isolated Power — career SLG minus AVG. >.220 elite, .180–.220 above avg, <.140 below avg. | EV ?Avg Exit Velocity (mph) — Statcast season-to-date. >92 elite, 89–92 above avg, <86 below avg. | Barrel% ?Barrel rate vs. this pitch mix — percentage of contact classified as barrels (perfect EV + LA combo). >12% elite, 8–12% above avg. | HR/FB ?Batter HR / Fly Ball rate for this matchup. A vs LHP/vs RHP chip means a handedness split is shown; otherwise the value is overall. | HR Dist ?Average distance (ft) of this batter's HRs. >400ft elite raw power, 380–400 above avg. | Sea HR% ?Season HR rate (HRs / PAs so far this year). v3.5 model feature — top backtest contributor. | 14d Pace ?Recent 14-day HR pace (HRs / games started). v3.5 model feature — captures current form. | Match% ?HR/FB Matchup — combined batter × pitcher HR/FB rate. The headline "how favorable is this matchup" number. | BBE ?Sample size — batted-ball events. <30 = small sample, treat stats with caution. | |
|---|---|---|---|---|---|---|---|---|---|---|---|---|---|---|---|---|
| 1 |

|
Colson Montgomery | 74 | 🟡 B | · | 🌤️ WARM | 10 | 0.274 | 90.1 | 9.4% | 30.2% vs RHP | 396 | 29.6% | 40.0% | 36.7% | 19 |
| 2 |

|
Randal Grichuk | 69 | 🔵 C+ | · | 🔥 HOT | 16 | 0.257 | 91.4 | 10.0% | 22.2% vs RHP | 389 | 21.4% | 20.0% | 31.2% | 12 |
| 3 |

|
Miguel Vargas ⚡ | 61 | 🔵 C+ | · | · | 37 | 0.230 | 90.1 | 9.5% | 15.8% vs RHP | 391 | 20.7% | 8.3% | 16.1% | 37 |
| 4 |

|
Andrew Benintendi | 60 | 🔵 C+ | · | 🌤️ WARM | 40 | 0.195 | 89.5 | 8.4% | 19.1% vs RHP | 393 | 17.4% | 28.6% | 25.9% | 21 |
| 5 |

|
Drew Romo | 50 | 🟠 C | · | 🌧️ COOL | 85 | 0.214 | 84.4 | 7.7% | 20.0% vs RHP | 368 | 6.2% | 0.0% | 17.0% | 15 |
| 6 |

|
Sam Antonacci | 43 | ⚪ D | · | 🌤️ WARM | 123 | 0.121 | 88.1 | 6.9% | 10.3% vs RHP | 419 | 6.1% | 20.0% | 14.2% | 26 |
| 7 |

|
Tristan Peters | 42 | ⚪ D | · | 🌤️ WARM | 132 | 0.158 | 86.1 | 5.3% | 9.4% vs RHP | 371 | 6.1% | 10.0% | 10.9% | 24 |
| 8 |

|
Jacob Gonzalez | 28 | ⚪ D | · | 🌤️ WARM | 199 | 0.068 | 88.2 | 4.8% | 16.7% vs RHP | 428 | 0.0% | 0.0% | 11.3% | 18 |

9 batters
| # | Batter | Score | Tier | Odds | Form | Rank | ISO ?Isolated Power — career SLG minus AVG. >.220 elite, .180–.220 above avg, <.140 below avg. | EV ?Avg Exit Velocity (mph) — Statcast season-to-date. >92 elite, 89–92 above avg, <86 below avg. | Barrel% ?Barrel rate vs. this pitch mix — percentage of contact classified as barrels (perfect EV + LA combo). >12% elite, 8–12% above avg. | HR/FB ?Batter HR / Fly Ball rate for this matchup. A vs LHP/vs RHP chip means a handedness split is shown; otherwise the value is overall. | HR Dist ?Average distance (ft) of this batter's HRs. >400ft elite raw power, 380–400 above avg. | Sea HR% ?Season HR rate (HRs / PAs so far this year). v3.5 model feature — top backtest contributor. | 14d Pace ?Recent 14-day HR pace (HRs / games started). v3.5 model feature — captures current form. | Match% ?HR/FB Matchup — combined batter × pitcher HR/FB rate. The headline "how favorable is this matchup" number. | BBE ?Sample size — batted-ball events. <30 = small sample, treat stats with caution. | |
|---|---|---|---|---|---|---|---|---|---|---|---|---|---|---|---|---|
| 1 |

|
Dillon Dingler | 61 | 🔵 C+ | · | 🌧️ COOL | 38 | 0.295 | 90.6 | 8.4% | 27.8% vs LHP | 394 | 20.0% | 8.3% | 22.4% | 32 |
| 2 |

|
Kerry Carpenter | 55 | 🟠 C | · | · | 61 | 0.243 | 91.0 | 7.7% | 21.7% | 373 | 15.8% | 18.2% | 26.3% | 20 |
| 3 |

|
Spencer Torkelson ⚡ | 52 | 🟠 C | · | 🌧️ COOL | 74 | 0.196 | 90.2 | 8.8% | 7.1% vs LHP | 394 | 16.4% | 25.0% | 18.3% | 20 |
| 4 |

|
Riley Greene | 43 | ⚪ D | · | 🌤️ WARM | 125 | 0.153 | 91.5 | 8.6% | 16.7% vs LHP | 389 | 9.5% | 16.7% | 14.3% | 26 |
| 5 |

|
Matt Vierling | 35 | ⚪ D | · | 🌤️ WARM | 167 | 0.133 | 87.2 | 6.1% | 12.5% vs LHP | 377 | 10.0% | 16.7% | 8.0% | 22 |
| 6 |

|
Kevin Mcgonigle | 33 | ⚪ D | · | · | 177 | 0.141 | 87.9 | 6.9% | 10.5% vs LHP | 392 | 0.0% | 0.0% | 13.1% | 33 |
| 7 |

|
Jake Rogers | 31 | ⚪ D | · | ❄ COLD | 189 | 0.108 | 86.1 | 7.4% | 4.0% | 389 | 9.1% | 0.0% | 8.6% | 5 |
| 8 |

|
Hao-Yu Lee | 31 | ⚪ D | · | ❄ COLD | 192 | 0.126 | 87.5 | 7.5% | 7.1% vs LHP | 382 | 0.0% | 0.0% | 7.2% | 11 |
| 9 |

|
Zach Mckinstry ⚡ | 19 | ⚪ D | · | 🌧️ COOL | 209 | 0.072 | 84.6 | 3.9% | 4.5% | 387 | 0.0% | 0.0% | 7.0% | 19 |