 CIN
CIN
@
1:35p
 NYY
NYY
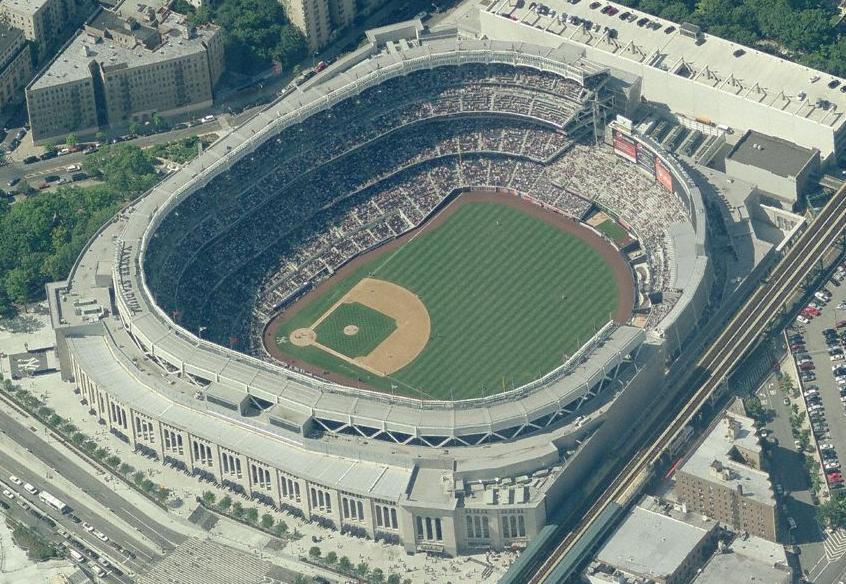
Stadium Conditions
Yankee Stadium
First pitch 1:35p
· roof open
Park 1.13×
Wind 6 mph out
81°F
open
+1
3 mph · in
68°F
1:35p
Neutral for HR environment
+1
3 mph · in
68°F
2:35p
Neutral for HR environment
+1
3 mph · in
68°F
3:35p
Neutral for HR environment
+1
3 mph · in
68°F
4:35p
Neutral for HR environment
+1
3 mph · in
68°F
5:35p
Neutral for HR environment
⚪ Boost · Combined 1.25
81°F, wind 6 mph S (out) — modifier: +1. Park, wind, temperature, and roof are inputs to Combined, not separate signals to stack on top.

7 batters
| # | Batter | Score | Tier | Odds | Form | Rank | ISO ?Isolated Power — career SLG minus AVG. >.220 elite, .180–.220 above avg, <.140 below avg. | EV ?Avg Exit Velocity (mph) — Statcast season-to-date. >92 elite, 89–92 above avg, <86 below avg. | Barrel% ?Barrel rate vs. this pitch mix — percentage of contact classified as barrels (perfect EV + LA combo). >12% elite, 8–12% above avg. | HR/FB ?Batter HR / Fly Ball rate for this matchup. A vs LHP/vs RHP chip means a handedness split is shown; otherwise the value is overall. | HR Dist ?Average distance (ft) of this batter's HRs. >400ft elite raw power, 380–400 above avg. | Sea HR% ?Season HR rate (HRs / PAs so far this year). v3.5 model feature — top backtest contributor. | 14d Pace ?Recent 14-day HR pace (HRs / games started). v3.5 model feature — captures current form. | Match% ?HR/FB Matchup — combined batter × pitcher HR/FB rate. The headline "how favorable is this matchup" number. | BBE ?Sample size — batted-ball events. <30 = small sample, treat stats with caution. | |
|---|---|---|---|---|---|---|---|---|---|---|---|---|---|---|---|---|
| 1 |

|
Ben Rice | 81 | 🟢 A | · | · | 3 | 0.316 | 92.2 | 10.5% | 55.6% vs LHP | 390 | 25.8% | 25.0% | 42.8% | 35 |
| 2 |

|
Paul Goldschmidt | 72 | 🟡 B | · | 🌧️ COOL | 13 | 0.245 | 87.1 | 8.9% | 33.3% vs LHP | 389 | 17.9% | 33.3% | 36.7% | 39 |
| 3 |

|
Cody Bellinger | 60 | 🔵 C+ | · | 🌧️ COOL | 43 | 0.196 | 89.2 | 7.3% | 18.2% vs LHP | 379 | 13.4% | 25.0% | 22.1% | 40 |
| 4 |

|
Amed Rosario | 57 | 🟠 C | · | ❄ COLD | 58 | 0.212 | 90.1 | 8.6% | 16.7% vs LHP | 403 | 7.1% | 0.0% | 15.7% | 12 |
| 5 |

|
Jasson Dominguez ⚡ | 54 | 🟠 C | · | 🌤️ WARM | 65 | 0.263 | 90.5 | 4.1% | 0.0% vs LHP | 353 | 0.0% | 0.0% | 17.3% | 16 |
| 6 |

|
Jose Caballero | 42 | ⚪ D | · | 🌧️ COOL | 133 | 0.145 | 83.6 | 4.6% | 30.0% vs LHP | 371 | 0.0% | 0.0% | 21.0% | 24 |
| 7 |

|
Anthony Volpe | 41 | ⚪ D | · | 🔥 HOT | 139 | 0.125 | 87.3 | 5.8% | 14.3% vs LHP | 409 | 3.1% | 0.0% | 9.4% | 23 |

8 batters
| # | Batter | Score | Tier | Odds | Form | Rank | ISO ?Isolated Power — career SLG minus AVG. >.220 elite, .180–.220 above avg, <.140 below avg. | EV ?Avg Exit Velocity (mph) — Statcast season-to-date. >92 elite, 89–92 above avg, <86 below avg. | Barrel% ?Barrel rate vs. this pitch mix — percentage of contact classified as barrels (perfect EV + LA combo). >12% elite, 8–12% above avg. | HR/FB ?Batter HR / Fly Ball rate for this matchup. A vs LHP/vs RHP chip means a handedness split is shown; otherwise the value is overall. | HR Dist ?Average distance (ft) of this batter's HRs. >400ft elite raw power, 380–400 above avg. | Sea HR% ?Season HR rate (HRs / PAs so far this year). v3.5 model feature — top backtest contributor. | 14d Pace ?Recent 14-day HR pace (HRs / games started). v3.5 model feature — captures current form. | Match% ?HR/FB Matchup — combined batter × pitcher HR/FB rate. The headline "how favorable is this matchup" number. | BBE ?Sample size — batted-ball events. <30 = small sample, treat stats with caution. | |
|---|---|---|---|---|---|---|---|---|---|---|---|---|---|---|---|---|
| 1 |

|
Jj Bleday | 62 | 🔵 C+ | · | 🌧️ COOL | 34 | 0.306 | 89.9 | 8.5% | 33.3% vs RHP | 385 | 0.0% | 0.0% | 34.1% | 37 |
| 2 |

|
Nathaniel Lowe | 58 | 🟠 C | · | ❄ COLD | 50 | 0.229 | 88.9 | 8.8% | 32.1% vs RHP | 398 | 17.1% | 0.0% | 19.2% | 17 |
| 3 |

|
Noelvi Marte | 57 | 🟠 C | · | 🔥 HOT | 51 | 0.187 | 89.0 | 6.5% | 50.0% vs RHP | 429 | 13.0% | 42.9% | 27.6% | 23 |
| 4 |

|
Sal Stewart | 57 | 🟠 C | · | · | 56 | 0.202 | 90.8 | 9.6% | 19.6% vs RHP | 395 | 10.2% | 16.7% | 15.5% | 35 |
| 5 |

|
Spencer Steer | 56 | 🟠 C | · | · | 59 | 0.192 | 89.6 | 9.2% | 14.3% vs RHP | 393 | 11.4% | 18.2% | 20.1% | 24 |
| 6 |

|
Matt Mclain | 44 | ⚪ D | · | 🔥 HOT | 118 | 0.163 | 88.8 | 8.0% | 10.2% vs RHP | 398 | 0.0% | 0.0% | 16.1% | 23 |
| 7 |

|
Blake Dunn | 33 | ⚪ D | · | ❄ COLD | 179 | 0.112 | 88.4 | 4.6% | 11.8% vs RHP | 381 | 4.2% | 0.0% | 7.8% | 31 |
| 8 |

|
Jose Trevino | 29 | ⚪ D | · | 🌤️ WARM | 194 | 0.089 | 85.1 | 4.1% | 16.7% vs RHP | 0 | 0.0% | 0.0% | 10.5% | 6 |