 CLE
CLE
@
7:40p
 MIL
MIL
Stadium Conditions
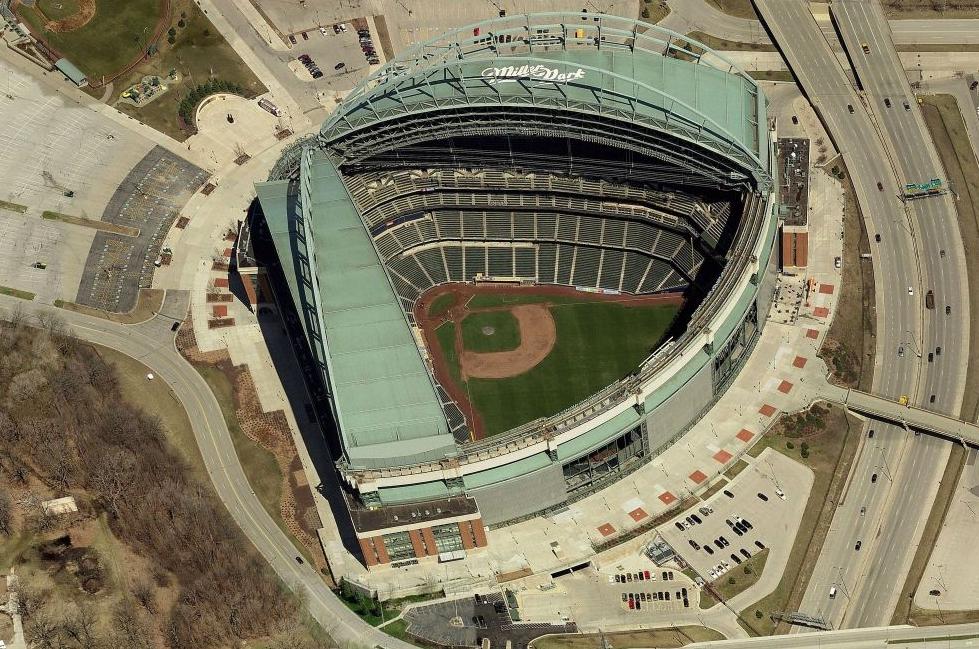
American Family Field
First pitch 7:40p
· roof retractable
Park 1.03×
Wind 5 mph cross
60°F
retractable
+6
5 mph · out
70°F
7:40p
Boost for HR environment
+6
5 mph · out
70°F
8:40p
Boost for HR environment
+6
5 mph · out
70°F
9:40p
Boost for HR environment
+6
5 mph · out
70°F
10:40p
Boost for HR environment
+6
5 mph · out
70°F
11:40p
Boost for HR environment
⚪ Soft suppress · Combined 0.92
59°F, wind 5 mph SW (cross) — modifier: -1. Park, wind, temperature, and roof are inputs to Combined, not separate signals to stack on top.

8 batters
| # | Batter | Score | Tier | Odds | Form | Rank | ISO ?Isolated Power — career SLG minus AVG. >.220 elite, .180–.220 above avg, <.140 below avg. | EV ?Avg Exit Velocity (mph) — Statcast season-to-date. >92 elite, 89–92 above avg, <86 below avg. | Barrel% ?Barrel rate vs. this pitch mix — percentage of contact classified as barrels (perfect EV + LA combo). >12% elite, 8–12% above avg. | HR/FB ?Batter HR / Fly Ball rate for this matchup. A vs LHP/vs RHP chip means a handedness split is shown; otherwise the value is overall. | HR Dist ?Average distance (ft) of this batter's HRs. >400ft elite raw power, 380–400 above avg. | Sea HR% ?Season HR rate (HRs / PAs so far this year). v3.5 model feature — top backtest contributor. | 14d Pace ?Recent 14-day HR pace (HRs / games started). v3.5 model feature — captures current form. | Match% ?HR/FB Matchup — combined batter × pitcher HR/FB rate. The headline "how favorable is this matchup" number. | BBE ?Sample size — batted-ball events. <30 = small sample, treat stats with caution. | |
|---|---|---|---|---|---|---|---|---|---|---|---|---|---|---|---|---|
| 1 |

|
Jake Bauers | 76 | 🟡 B | +750 | 🌤️ WARM | 6 | 0.282 | 92.6 | 12.7% | 38.9% vs RHP | 399 | 20.8% | 30.0% | 36.9% | 19 |
| 2 |

|
Jackson Chourio | 76 | 🟡 B | · | · | 7 | 0.255 | 92.4 | 13.6% | 19.4% vs RHP | 399 | 19.4% | 57.1% | 34.1% | 43 |
| 3 |

|
Brice Turang | 58 | 🟠 C | · | 🌧️ COOL | 53 | 0.198 | 90.7 | 9.9% | 27.0% vs RHP | 405 | 11.9% | 27.3% | 26.8% | 33 |
| 4 |

|
Garrett Mitchell | 55 | 🟠 C | · | 🌤️ WARM | 67 | 0.158 | 92.3 | 12.9% | 25.0% vs RHP | 418 | 7.8% | 16.7% | 17.9% | 28 |
| 5 |

|
William Contreras | 46 | ⚪ D | +850 | 🌧️ COOL | 113 | 0.143 | 89.7 | 9.1% | 16.3% vs RHP | 420 | 9.2% | 16.7% | 11.3% | 41 |
| 6 |

|
Christian Yelich | 39 | ⚪ D | · | · | 155 | 0.134 | 88.3 | 8.1% | 12.5% vs RHP | 402 | 5.6% | 0.0% | 9.0% | 33 |
| 7 |

|
David Hamilton | 37 | ⚪ D | · | 🌤️ WARM | 167 | 0.101 | 86.3 | 6.6% | 7.7% vs RHP | 383 | 5.9% | 18.2% | 13.8% | 23 |
| 8 |

|
Sal Frelick | 28 | ⚪ D | · | 🌧️ COOL | 208 | 0.087 | 85.9 | 4.9% | 7.1% vs RHP | 402 | 3.4% | 0.0% | 8.1% | 26 |

9 batters
| # | Batter | Score | Tier | Odds | Form | Rank | ISO ?Isolated Power — career SLG minus AVG. >.220 elite, .180–.220 above avg, <.140 below avg. | EV ?Avg Exit Velocity (mph) — Statcast season-to-date. >92 elite, 89–92 above avg, <86 below avg. | Barrel% ?Barrel rate vs. this pitch mix — percentage of contact classified as barrels (perfect EV + LA combo). >12% elite, 8–12% above avg. | HR/FB ?Batter HR / Fly Ball rate for this matchup. A vs LHP/vs RHP chip means a handedness split is shown; otherwise the value is overall. | HR Dist ?Average distance (ft) of this batter's HRs. >400ft elite raw power, 380–400 above avg. | Sea HR% ?Season HR rate (HRs / PAs so far this year). v3.5 model feature — top backtest contributor. | 14d Pace ?Recent 14-day HR pace (HRs / games started). v3.5 model feature — captures current form. | Match% ?HR/FB Matchup — combined batter × pitcher HR/FB rate. The headline "how favorable is this matchup" number. | BBE ?Sample size — batted-ball events. <30 = small sample, treat stats with caution. | |
|---|---|---|---|---|---|---|---|---|---|---|---|---|---|---|---|---|
| 1 |

|
Rhys Hoskins | 56 | 🟠 C | +1000 | 🌧️ COOL | 63 | 0.185 | 88.6 | 9.8% | 17.6% vs RHP | 379 | 10.9% | 11.1% | 14.7% | 20 |
| 2 |

|
Kyle Manzardo | 53 | 🟠 C | +950 | 🌤️ WARM | 74 | 0.165 | 89.3 | 10.0% | 20.6% vs RHP | 390 | 9.7% | 11.1% | 11.6% | 21 |
| 3 |

|
Travis Bazzana | 49 | ⚪ D | · | 🌧️ COOL | 87 | 0.187 | 88.5 | 5.4% | 16.0% vs RHP | 396 | 10.7% | 8.3% | 12.3% | 31 |
| 4 |

|
Daniel Schneemann | 44 | ⚪ D | · | · | 126 | 0.144 | 87.8 | 7.4% | 12.9% vs RHP | 400 | 6.7% | 0.0% | 10.2% | 18 |
| 5 |

|
David Fry | 42 | ⚪ D | · | 🔥 HOT | 140 | 0.138 | 86.9 | 7.7% | 22.2% vs RHP | 376 | 0.0% | 0.0% | 14.3% | 6 |
| 6 |

|
Brayan Rocchio | 40 | ⚪ D | · | · | 149 | 0.132 | 86.8 | 5.1% | 12.9% vs RHP | 382 | 6.1% | 8.3% | 8.4% | 31 |
| 7 |

|
Patrick Bailey | 37 | ⚪ D | · | ❄ COLD | 172 | 0.079 | 89.8 | 7.8% | 5.0% vs RHP | 407 | 3.5% | 0.0% | 7.3% | 14 |
| 8 |

|
Petey Halpin | 32 | ⚪ D | · | · | 191 | 0.033 | 88.5 | 8.8% | 0.0% vs RHP | 0 | 0.0% | 0.0% | 8.6% | 0 |
| 9 |

|
Steven Kwan ⚡ | 23 | ⚪ D | · | 🌧️ COOL | 227 | 0.047 | 83.0 | 2.1% | 2.4% vs RHP | 381 | 1.6% | 0.0% | 6.9% | 32 |