 COL
COL
@
8:05p
 CHC
CHC
Stadium Conditions
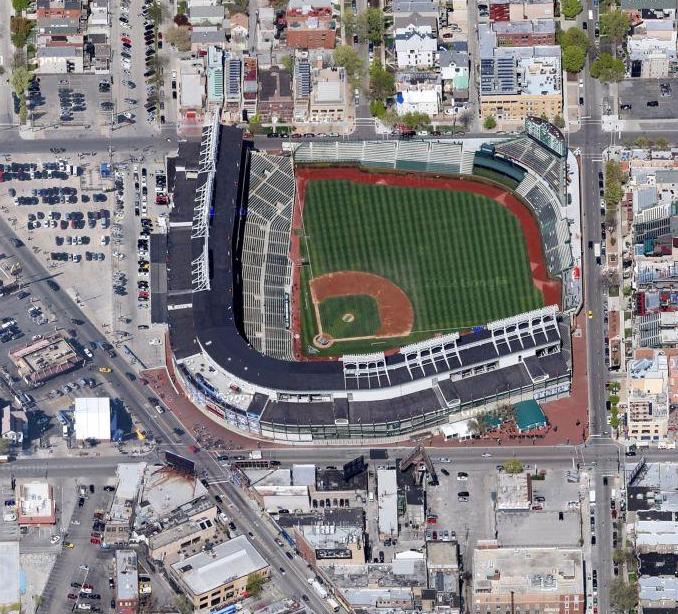
Wrigley Field
First pitch 8:05p
· roof open
Park 1.01×
Wind 11 mph in
61°F
open
-4
5 mph · in
68°F
8:05p
Neutral for HR environment
-4
5 mph · in
68°F
9:05p
Neutral for HR environment
-4
5 mph · in
68°F
10:05p
Neutral for HR environment
-4
5 mph · in
68°F
11:05p
Neutral for HR environment
-4
5 mph · in
68°F
12:05a
Neutral for HR environment
⚪ Suppress · Combined 0.60
61°F, wind 11 mph SSE (in) — modifier: -4. Park, wind, temperature, and roof are inputs to Combined, not separate signals to stack on top.
COL Bullpen Proxy
1.40 HR/9
· FIP-xFIP +0.00
·
9 batters
| # | Batter | Score | Tier | Odds | Form | Rank | ISO ?Isolated Power — career SLG minus AVG. >.220 elite, .180–.220 above avg, <.140 below avg. | EV ?Avg Exit Velocity (mph) — Statcast season-to-date. >92 elite, 89–92 above avg, <86 below avg. | Barrel% ?Barrel rate vs. this pitch mix — percentage of contact classified as barrels (perfect EV + LA combo). >12% elite, 8–12% above avg. | HR/FB ?Batter HR / Fly Ball rate for this matchup. A vs LHP/vs RHP chip means a handedness split is shown; otherwise the value is overall. | HR Dist ?Average distance (ft) of this batter's HRs. >400ft elite raw power, 380–400 above avg. | Sea HR% ?Season HR rate (HRs / PAs so far this year). v3.5 model feature — top backtest contributor. | 14d Pace ?Recent 14-day HR pace (HRs / games started). v3.5 model feature — captures current form. | Match% ?HR/FB Matchup — combined batter × pitcher HR/FB rate. The headline "how favorable is this matchup" number. | BBE ?Sample size — batted-ball events. <30 = small sample, treat stats with caution. | |
|---|---|---|---|---|---|---|---|---|---|---|---|---|---|---|---|---|
| 1 |

|
Ian Happ | 75 | 🟡 B | +475 | 🌧️ COOL | 10 | 0.255 | 90.1 | 14.6% | 22.1% | 403 | 23.9% | 23.1% | 28.6% | 33 |
| 2 |

|
Pete Crow-Armstrong | 67 | 🔵 C+ | +390 | · | 22 | 0.210 | 91.6 | 11.5% | 14.4% | 395 | 18.1% | 46.2% | 22.2% | 42 |
| 3 |

|
Seiya Suzuki | 56 | 🟠 C | +475 | 🔥 HOT | 59 | 0.176 | 89.3 | 9.5% | 18.5% | 409 | 11.8% | 27.3% | 19.7% | 27 |
| 4 |

|
Michael Busch | 54 | 🟠 C | +475 | · | 72 | 0.163 | 88.7 | 11.6% | 11.8% | 400 | 11.0% | 15.4% | 14.2% | 28 |
| 5 |

|
Matt Shaw | 44 | ⚪ D | +900 | 🌤️ WARM | 125 | 0.177 | 86.6 | 5.9% | 13.8% | 357 | 10.5% | 0.0% | 11.0% | 9 |
| 6 |

|
Alex Bregman | 39 | ⚪ D | +700 | ❄ COLD | 157 | 0.137 | 88.0 | 5.1% | 10.7% | 395 | 7.0% | 7.7% | 8.2% | 41 |
| 7 |

|
Dansby Swanson | 39 | ⚪ D | +475 | ❄ COLD | 158 | 0.125 | 89.0 | 6.6% | 9.9% | 398 | 10.0% | 0.0% | 7.7% | 23 |
| 8 |

|
Carson Kelly ⚡ | 36 | ⚪ D | +625 | 🌧️ COOL | 177 | 0.092 | 88.8 | 6.6% | 6.7% | 418 | 4.8% | 10.0% | 7.4% | 20 |
| 9 |

|
Nico Hoerner ⚡ | 26 | ⚪ D | · | 🌧️ COOL | 213 | 0.096 | 85.8 | 1.1% | 5.1% | 383 | 5.6% | 0.0% | 7.1% | 45 |

8 batters
| # | Batter | Score | Tier | Odds | Form | Rank | ISO ?Isolated Power — career SLG minus AVG. >.220 elite, .180–.220 above avg, <.140 below avg. | EV ?Avg Exit Velocity (mph) — Statcast season-to-date. >92 elite, 89–92 above avg, <86 below avg. | Barrel% ?Barrel rate vs. this pitch mix — percentage of contact classified as barrels (perfect EV + LA combo). >12% elite, 8–12% above avg. | HR/FB ?Batter HR / Fly Ball rate for this matchup. A vs LHP/vs RHP chip means a handedness split is shown; otherwise the value is overall. | HR Dist ?Average distance (ft) of this batter's HRs. >400ft elite raw power, 380–400 above avg. | Sea HR% ?Season HR rate (HRs / PAs so far this year). v3.5 model feature — top backtest contributor. | 14d Pace ?Recent 14-day HR pace (HRs / games started). v3.5 model feature — captures current form. | Match% ?HR/FB Matchup — combined batter × pitcher HR/FB rate. The headline "how favorable is this matchup" number. | BBE ?Sample size — batted-ball events. <30 = small sample, treat stats with caution. | |
|---|---|---|---|---|---|---|---|---|---|---|---|---|---|---|---|---|
| 1 |

|
Hunter Goodman | 69 | 🔵 C+ | +320 | · | 19 | 0.285 | 91.3 | 8.8% | 40.0% vs RHP | 403 | 25.4% | 33.3% | 25.1% | 30 |
| 2 |

|
Tj Rumfield | 40 | ⚪ D | +950 | 🌧️ COOL | 146 | 0.185 | 85.0 | 5.5% | 18.8% vs RHP | 409 | 0.0% | 0.0% | 20.3% | 39 |
| 3 |

|
Ezequiel Tovar | 37 | ⚪ D | +850 | 🌤️ WARM | 169 | 0.137 | 88.1 | 6.3% | 17.5% vs RHP | 422 | 6.1% | 8.3% | 6.6% | 22 |
| 4 |

|
Jake Mccarthy | 34 | ⚪ D | · | 🌧️ COOL | 185 | 0.157 | 84.9 | 5.1% | 13.8% vs RHP | 418 | 0.0% | 0.0% | 10.3% | 24 |
| 5 |

|
Kyle Karros | 33 | ⚪ D | · | 🌤️ WARM | 186 | 0.118 | 89.1 | 5.8% | 10.5% vs RHP | 408 | 5.6% | 0.0% | 5.8% | 32 |
| 6 |

|
Edouard Julien | 32 | ⚪ D | +950 | 🌤️ WARM | 190 | 0.106 | 91.4 | 5.8% | 12.0% vs RHP | 389 | 3.3% | 0.0% | 8.4% | 19 |
| 7 |

|
Tyler Freeman ⚡ | 27 | ⚪ D | · | 🌤️ WARM | 210 | 0.105 | 87.6 | 2.7% | 5.0% vs RHP | 369 | 4.0% | 0.0% | 6.6% | 16 |
| 8 |

|
Sterlin Thompson | 16 | ⚪ D | · | 🌧️ COOL | 231 | 0.052 | 87.0 | · | 0.0% vs RHP | 0 | 0.0% | 0.0% | 6.8% | 13 |