 CHC
CHC
@
10:15p
 SF
SF
Stadium Conditions
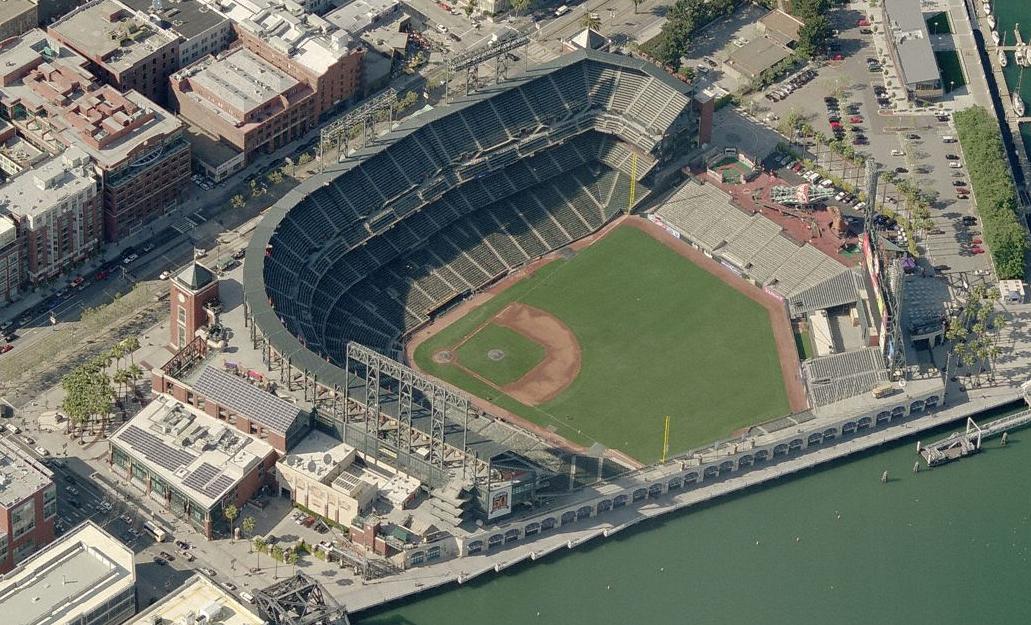
Oracle Park
First pitch 10:15p
· roof open
Park 0.92×
Wind 10 mph cross
69°F
open
+7
15 mph · slight_out
64°F
10:15p
Boost for HR environment
+7
15 mph · slight_out
64°F
11:15p
Boost for HR environment
+7
15 mph · slight_out
64°F
12:15a
Boost for HR environment
+7
15 mph · slight_out
64°F
1:15a
Boost for HR environment
+7
15 mph · slight_out
64°F
2:15a
Boost for HR environment
⚪ Soft suppress · Combined 0.92
69°F, wind 10 mph NNW (cross) — modifier: +0. Park, wind, temperature, and roof are inputs to Combined, not separate signals to stack on top.

9 batters
| # | Batter | Score | Tier | Odds | Form | Rank | ISO ?Isolated Power — career SLG minus AVG. >.220 elite, .180–.220 above avg, <.140 below avg. | EV ?Avg Exit Velocity (mph) — Statcast season-to-date. >92 elite, 89–92 above avg, <86 below avg. | Barrel% ?Barrel rate vs. this pitch mix — percentage of contact classified as barrels (perfect EV + LA combo). >12% elite, 8–12% above avg. | HR/FB ?Batter HR / Fly Ball rate for this matchup. A vs LHP/vs RHP chip means a handedness split is shown; otherwise the value is overall. | HR Dist ?Average distance (ft) of this batter's HRs. >400ft elite raw power, 380–400 above avg. | Sea HR% ?Season HR rate (HRs / PAs so far this year). v3.5 model feature — top backtest contributor. | 14d Pace ?Recent 14-day HR pace (HRs / games started). v3.5 model feature — captures current form. | Match% ?HR/FB Matchup — combined batter × pitcher HR/FB rate. The headline "how favorable is this matchup" number. | BBE ?Sample size — batted-ball events. <30 = small sample, treat stats with caution. | |
|---|---|---|---|---|---|---|---|---|---|---|---|---|---|---|---|---|
| 1 |

|
Ian Happ | 57 | 🟠 C | +575 | 🌤️ WARM | 54 | 0.264 | 90.8 | 7.1% | 34.2% vs RHP | 403 | 24.2% | 25.0% | 26.8% | 28 |
| 2 |

|
Pete Crow-Armstrong | 45 | ⚪ D | +425 | 🌤️ WARM | 107 | 0.182 | 91.2 | 6.1% | 17.4% vs RHP | 392 | 14.9% | 33.3% | 16.7% | 40 |
| 3 |

|
Seiya Suzuki | 40 | ⚪ D | +700 | 🌤️ WARM | 139 | 0.162 | 89.2 | 5.5% | 23.3% vs RHP | 409 | 12.8% | 27.3% | 16.7% | 31 |
| 4 |

|
Michael Busch | 35 | ⚪ D | +575 | 🌧️ COOL | 177 | 0.158 | 88.7 | 6.0% | 14.3% vs RHP | 402 | 10.3% | 8.3% | 8.2% | 33 |
| 5 |

|
Moises Ballesteros | 32 | ⚪ D | +950 | ❄ COLD | 190 | 0.169 | 90.4 | 5.6% | 21.4% vs RHP | 390 | 0.0% | 0.0% | 9.6% | 17 |
| 6 |

|
Alex Bregman | 30 | ⚪ D | +850 | 🌧️ COOL | 198 | 0.133 | 88.1 | 4.2% | 16.3% vs RHP | 395 | 7.6% | 16.7% | 7.9% | 38 |
| 7 |

|
Dansby Swanson | 29 | ⚪ D | +950 | ❄ COLD | 203 | 0.135 | 89.4 | 4.8% | 11.1% vs RHP | 398 | 10.8% | 0.0% | 7.0% | 19 |
| 8 |

|
Carson Kelly ⚡ | 23 | ⚪ D | +700 | ❄ COLD | 222 | 0.079 | 88.8 | 4.7% | 0.0% vs RHP | 418 | 5.2% | 11.1% | 5.5% | 25 |
| 9 |

|
Nico Hoerner ⚡ | 19 | ⚪ D | · | 🌤️ WARM | 230 | 0.101 | 85.9 | 2.0% | 4.9% vs RHP | 383 | 6.0% | 0.0% | 6.1% | 47 |

7 batters
| # | Batter | Score | Tier | Odds | Form | Rank | ISO ?Isolated Power — career SLG minus AVG. >.220 elite, .180–.220 above avg, <.140 below avg. | EV ?Avg Exit Velocity (mph) — Statcast season-to-date. >92 elite, 89–92 above avg, <86 below avg. | Barrel% ?Barrel rate vs. this pitch mix — percentage of contact classified as barrels (perfect EV + LA combo). >12% elite, 8–12% above avg. | HR/FB ?Batter HR / Fly Ball rate for this matchup. A vs LHP/vs RHP chip means a handedness split is shown; otherwise the value is overall. | HR Dist ?Average distance (ft) of this batter's HRs. >400ft elite raw power, 380–400 above avg. | Sea HR% ?Season HR rate (HRs / PAs so far this year). v3.5 model feature — top backtest contributor. | 14d Pace ?Recent 14-day HR pace (HRs / games started). v3.5 model feature — captures current form. | Match% ?HR/FB Matchup — combined batter × pitcher HR/FB rate. The headline "how favorable is this matchup" number. | BBE ?Sample size — batted-ball events. <30 = small sample, treat stats with caution. | |
|---|---|---|---|---|---|---|---|---|---|---|---|---|---|---|---|---|
| 1 |

|
Casey Schmitt | 55 | 🟠 C | +500 | 🌧️ COOL | 65 | 0.238 | 89.4 | 8.3% | 23.5% vs RHP | 393 | 19.0% | 15.4% | 13.1% | 52 |
| 2 |

|
Willy Adames | 50 | 🟠 C | +525 | 🌤️ WARM | 78 | 0.200 | 89.2 | 7.2% | 19.6% vs RHP | 385 | 14.3% | 25.0% | 15.2% | 33 |
| 3 |

|
Rafael Devers | 46 | ⚪ D | +425 | · | 100 | 0.180 | 91.8 | 7.4% | 17.1% vs RHP | 401 | 13.2% | 15.4% | 13.6% | 34 |
| 4 |

|
Matt Chapman | 40 | ⚪ D | +625 | 🔥 HOT | 136 | 0.159 | 88.3 | 6.1% | 15.6% vs RHP | 397 | 6.2% | 23.1% | 11.5% | 43 |
| 5 |

|
Drew Gilbert ⚡ | 31 | ⚪ D | +950 | 🔥 HOT | 191 | 0.135 | 84.9 | 3.9% | 17.6% vs RHP | 393 | 4.0% | 12.5% | 8.6% | 22 |
| 6 |

|
Jung Hoo Lee | 28 | ⚪ D | · | 🌤️ WARM | 204 | 0.129 | 87.7 | 3.6% | 9.7% vs RHP | 363 | 5.3% | 0.0% | 7.5% | 52 |
| 7 |

|
Luis Arraez ⚡ | 21 | ⚪ D | · | 🌤️ WARM | 226 | 0.112 | · | 1.5% | 1.7% vs RHP | · | 0.0% | 0.0% | 6.5% | 57 |