 ATL
ATL
@
—
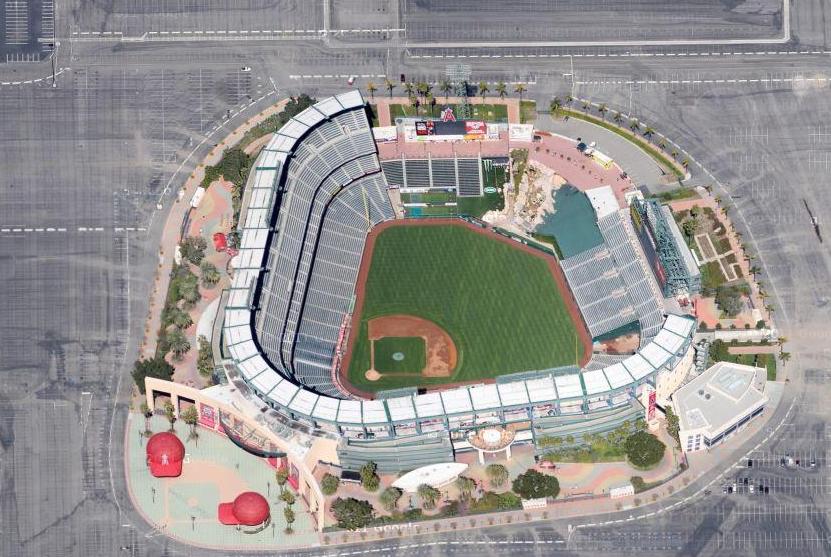
 LAA
LAA
Park Factor
1.11×
Weather Mod
-1.0%
cool air · light wind in · roof open
Combined
0.999
Temp
56.3°F
Wind
3.0 mph
in
Roof
open

Grant Holmes
RHP
9 batters
| # | Batter | Score | Tier | Odds | Form | Rank | ISO ?Isolated Power — career SLG minus AVG. >.220 elite, .180–.220 above avg, <.140 below avg. | EV ?Avg Exit Velocity (mph) — Statcast season-to-date. >92 elite, 89–92 above avg, <86 below avg. | Barrel% ?Barrel rate vs. this pitch mix — percentage of contact classified as barrels (perfect EV + LA combo). >12% elite, 8–12% above avg. | HR/FB ?Batter HR / Fly Ball rate — career, all pitchers. >18% elite, 14–18% above avg, <10% below avg. | HR Dist ?Average distance (ft) of this batter's HRs. >400ft elite raw power, 380–400 above avg. | Sea HR% ?Season HR rate (HRs / PAs so far this year). v3.5 model feature — top backtest contributor. | 14d Pace ?Recent 14-day HR pace (HRs / games started). v3.5 model feature — captures current form. | Match% ?HR/FB Matchup — combined batter × pitcher HR/FB rate. The headline "how favorable is this matchup" number. | BBE ?Sample size — batted-ball events. <30 = small sample, treat stats with caution. | |
|---|---|---|---|---|---|---|---|---|---|---|---|---|---|---|---|---|
| 1 |

|
Mike Trout | 73 | 🟡 B | · | 🌤️ WARM | 6 | 0.206 | 90.9 | 12.6% | 21.3% | 408 | 20.0% | 20.0% | 31.3% | 24 |
| 2 |

|
Zach Neto | 68 | 🔵 C+ | · | 🌧️ COOL | 12 | 0.217 | 91.0 | 11.9% | 17.8% | 404 | 30.0% | 30.0% | 30.2% | 32 |
| 3 |

|
Jo Adell | 63 | 🔵 C+ | · | ❄ COLD | 20 | 0.249 | 91.7 | 13.2% | 22.0% | 411 | 10.0% | 10.0% | 22.4% | 36 |
| 4 |

|
Yoan Moncada | 63 | 🔵 C+ | · | · | 21 | 0.214 | 89.8 | 12.0% | 16.4% | 393 | 10.0% | 10.0% | 20.1% | 17 |
| 5 |

|
Jorge Soler | 60 | 🔵 C+ | · | 🌧️ COOL | 25 | 0.172 | 89.7 | 11.4% | 15.6% | 400 | 20.0% | 20.0% | 22.4% | 23 |
| 6 |

|
Taylor Ward | 59 | 🟠 C | · | 🌧️ COOL | 31 | 0.247 | 90.1 | 11.8% | 18.2% | 396 | 0.0% | 0.0% | 20.4% | 32 |
| 7 |

|
Logan O'Hoppe | 48 | ⚪ D | · | 🌧️ COOL | 86 | 0.158 | 90.9 | 11.6% | 16.4% | 402 | 0.0% | 0.0% | 12.5% | 23 |
| 8 |

|
Nolan Schanuel | 48 | ⚪ D | · | · | 90 | 0.125 | 87.5 | 6.7% | 8.2% | 394 | 20.0% | 20.0% | 8.2% | 36 |
| 9 |

|
Luis Rengifo | 39 | ⚪ D | · | 🌤️ WARM | 156 | 0.098 | 87.1 | 7.1% | 8.8% | 392 | 0.0% | 0.0% | 7.6% | 27 |

Reid Detmers
LHP
9 batters
| # | Batter | Score | Tier | Odds | Form | Rank | ISO ?Isolated Power — career SLG minus AVG. >.220 elite, .180–.220 above avg, <.140 below avg. | EV ?Avg Exit Velocity (mph) — Statcast season-to-date. >92 elite, 89–92 above avg, <86 below avg. | Barrel% ?Barrel rate vs. this pitch mix — percentage of contact classified as barrels (perfect EV + LA combo). >12% elite, 8–12% above avg. | HR/FB ?Batter HR / Fly Ball rate — career, all pitchers. >18% elite, 14–18% above avg, <10% below avg. | HR Dist ?Average distance (ft) of this batter's HRs. >400ft elite raw power, 380–400 above avg. | Sea HR% ?Season HR rate (HRs / PAs so far this year). v3.5 model feature — top backtest contributor. | 14d Pace ?Recent 14-day HR pace (HRs / games started). v3.5 model feature — captures current form. | Match% ?HR/FB Matchup — combined batter × pitcher HR/FB rate. The headline "how favorable is this matchup" number. | BBE ?Sample size — batted-ball events. <30 = small sample, treat stats with caution. | |
|---|---|---|---|---|---|---|---|---|---|---|---|---|---|---|---|---|
| 1 |

|
Drake Baldwin | 66 | 🔵 C+ | · | 🌤️ WARM | 17 | 0.195 | 91.7 | 9.5% | 18.1% | 398 | 45.5% | 45.5% | 24.8% | 42 |
| 2 |

|
Matt Olson | 55 | 🟠 C | · | 🌧️ COOL | 49 | 0.212 | 93.3 | 10.8% | 16.0% | 407 | 9.1% | 9.1% | 21.7% | 28 |
| 3 |

|
Ronald Acuna Jr. | 53 | 🟠 C | · | 🌧️ COOL | 60 | 0.228 | 92.7 | 11.3% | 23.1% | 419 | 0.0% | 0.0% | 19.4% | 36 |
| 4 | Michael Harris II | 53 | 🟠 C | · | 🔥 HOT | 63 | 0.160 | 90.2 | 8.6% | 12.5% | 411 | 9.1% | 9.1% | 10.0% | 36 | |
| 5 |

|
Jurickson Profar | 45 | ⚪ D | · | · | 108 | 0.189 | 89.0 | 7.7% | 11.3% | 390 | 0.0% | 0.0% | 14.1% | 0 |
| 6 |

|
Ozzie Albies | 43 | ⚪ D | · | · | 125 | 0.124 | 87.5 | 6.3% | 7.2% | 380 | 18.2% | 18.2% | 10.0% | 38 |
| 7 |

|
Austin Riley | 42 | ⚪ D | · | ❄ COLD | 130 | 0.168 | 92.3 | 11.2% | 12.4% | 413 | 0.0% | 0.0% | 10.5% | 31 |
| 8 |

|
Marcell Ozuna | 39 | ⚪ D | · | ❄ COLD | 154 | 0.168 | 89.9 | 9.7% | 15.0% | 411 | 0.0% | 0.0% | 11.5% | 23 |
| 9 |

|
Nick Allen | 14 | ⚪ D | · | 🌤️ WARM | 243 | 0.030 | 84.8 | 0.0% | 0.0% | · | 0.0% | 0.0% | 1.3% | 7 |