 WSH
WSH
@
1:40p
 TB
TB
Stadium Conditions
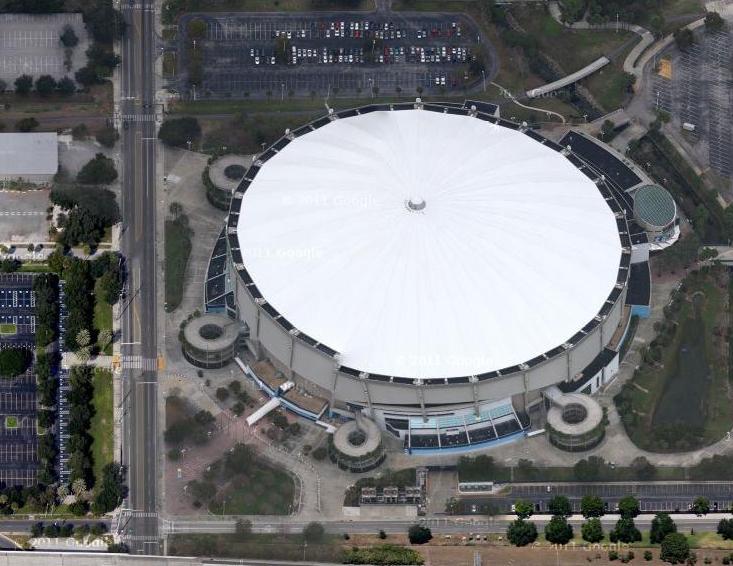
Tropicana Field
First pitch 1:40p
· roof unknown
Park 1.02×
Wind 0 mph dome
—
unknown
Hourly forecast unavailable; showing current stadium conditions only.
⚪ Elevated · Combined 1.02
Dome — weather irrelevant. Park, wind, temperature, and roof are inputs to Combined, not separate signals to stack on top.

8 batters
| # | Batter | Score | Tier | Odds | Form | Rank | ISO ?Isolated Power — career SLG minus AVG. >.220 elite, .180–.220 above avg, <.140 below avg. | EV ?Avg Exit Velocity (mph) — Statcast season-to-date. >92 elite, 89–92 above avg, <86 below avg. | Barrel% ?Barrel rate vs. this pitch mix — percentage of contact classified as barrels (perfect EV + LA combo). >12% elite, 8–12% above avg. | HR/FB ?Batter HR / Fly Ball rate for this matchup. A vs LHP/vs RHP chip means a handedness split is shown; otherwise the value is overall. | HR Dist ?Average distance (ft) of this batter's HRs. >400ft elite raw power, 380–400 above avg. | Sea HR% ?Season HR rate (HRs / PAs so far this year). v3.5 model feature — top backtest contributor. | 14d Pace ?Recent 14-day HR pace (HRs / games started). v3.5 model feature — captures current form. | Match% ?HR/FB Matchup — combined batter × pitcher HR/FB rate. The headline "how favorable is this matchup" number. | BBE ?Sample size — batted-ball events. <30 = small sample, treat stats with caution. | |
|---|---|---|---|---|---|---|---|---|---|---|---|---|---|---|---|---|
| 1 |

|
James Wood | 72 | 🟡 B | · | 🌧️ COOL | 10 | 0.254 | 95.7 | 12.7% | 35.7% vs RHP | 408 | 27.6% | 25.0% | 29.5% | 36 |
| 2 |

|
Curtis Mead | 61 | 🔵 C+ | · | 🌧️ COOL | 41 | 0.235 | 88.7 | 8.6% | 23.1% vs RHP | 400 | 18.9% | 22.2% | 24.9% | 27 |
| 3 |

|
Dylan Crews | 52 | 🟠 C | · | · | 81 | 0.144 | 90.9 | 8.1% | 20.0% vs RHP | 415 | 26.3% | 33.3% | 16.6% | 36 |
| 4 |

|
Cj Abrams ⚡ | 50 | 🟠 C | · | · | 86 | 0.221 | 90.1 | 8.4% | 27.7% vs RHP | 390 | 0.0% | 0.0% | 24.7% | 35 |
| 5 |

|
Daylen Lile | 41 | ⚪ D | · | 🌧️ COOL | 142 | 0.160 | 87.6 | 7.0% | 11.8% vs RHP | 403 | 8.8% | 0.0% | 8.7% | 36 |
| 6 |

|
Jose Tena | 38 | ⚪ D | · | 🌤️ WARM | 153 | 0.126 | 92.4 | 8.3% | 15.8% vs RHP | 398 | 0.0% | 0.0% | 7.6% | 9 |
| 7 |

|
Drew Millas | 29 | ⚪ D | · | 🌤️ WARM | 202 | 0.088 | 82.9 | 5.0% | 14.3% vs RHP | 398 | 5.9% | 0.0% | 9.3% | 7 |
| 8 |

|
Nasim Nunez | 15 | ⚪ D | · | · | 235 | 0.041 | 84.4 | · | 0.0% vs RHP | 0 | 0.0% | 0.0% | 5.8% | 23 |

9 batters
| # | Batter | Score | Tier | Odds | Form | Rank | ISO ?Isolated Power — career SLG minus AVG. >.220 elite, .180–.220 above avg, <.140 below avg. | EV ?Avg Exit Velocity (mph) — Statcast season-to-date. >92 elite, 89–92 above avg, <86 below avg. | Barrel% ?Barrel rate vs. this pitch mix — percentage of contact classified as barrels (perfect EV + LA combo). >12% elite, 8–12% above avg. | HR/FB ?Batter HR / Fly Ball rate for this matchup. A vs LHP/vs RHP chip means a handedness split is shown; otherwise the value is overall. | HR Dist ?Average distance (ft) of this batter's HRs. >400ft elite raw power, 380–400 above avg. | Sea HR% ?Season HR rate (HRs / PAs so far this year). v3.5 model feature — top backtest contributor. | 14d Pace ?Recent 14-day HR pace (HRs / games started). v3.5 model feature — captures current form. | Match% ?HR/FB Matchup — combined batter × pitcher HR/FB rate. The headline "how favorable is this matchup" number. | BBE ?Sample size — batted-ball events. <30 = small sample, treat stats with caution. | |
|---|---|---|---|---|---|---|---|---|---|---|---|---|---|---|---|---|
| 1 |

|
Junior Caminero ⚡ | 53 | 🟠 C | · | 🌤️ WARM | 79 | 0.203 | 93.1 | 8.6% | 37.5% vs LHP | 406 | 20.0% | 8.3% | 17.2% | 32 |
| 2 |

|
Jonathan Aranda | 48 | ⚪ D | · | 🌧️ COOL | 96 | 0.185 | 90.8 | 8.5% | 7.7% vs LHP | 391 | 14.7% | 9.1% | 10.2% | 35 |
| 3 |

|
Yandy Diaz ⚡ | 39 | ⚪ D | · | 🌧️ COOL | 147 | 0.178 | 90.5 | 7.1% | 18.2% vs LHP | 385 | 0.0% | 0.0% | 12.4% | 38 |
| 4 |

|
Ryan Vilade | 34 | ⚪ D | · | · | 183 | 0.157 | 89.3 | 5.2% | 10.0% vs LHP | 416 | 0.0% | 0.0% | 9.9% | 20 |
| 5 |

|
Jonny Deluca | 33 | ⚪ D | · | 🔥 HOT | 189 | 0.154 | 85.7 | 5.1% | 18.2% vs LHP | 410 | 0.0% | 0.0% | 13.4% | 3 |
| 6 |

|
Ben Williamson | 26 | ⚪ D | · | 🌤️ WARM | 214 | 0.090 | 88.8 | 3.2% | 15.4% vs LHP | 394 | 1.9% | 12.5% | 8.8% | 26 |
| 7 |

|
Nick Fortes | 21 | ⚪ D | · | 🌤️ WARM | 226 | 0.075 | 86.6 | 2.9% | 0.0% vs LHP | 408 | 0.0% | 0.0% | 6.7% | 21 |
| 8 |

|
Taylor Walls | 20 | ⚪ D | · | 🌤️ WARM | 232 | 0.061 | 83.9 | 3.9% | 0.0% vs LHP | 0 | 0.0% | 0.0% | 6.7% | 23 |
| 9 |

|
Chandler Simpson | 14 | ⚪ D | · | 🌧️ COOL | 236 | 0.056 | 83.9 | · | 0.0% vs LHP | 0 | 0.0% | 0.0% | 6.2% | 28 |