 TEX
TEX
@
7:40p
 KC
KC
Stadium Conditions
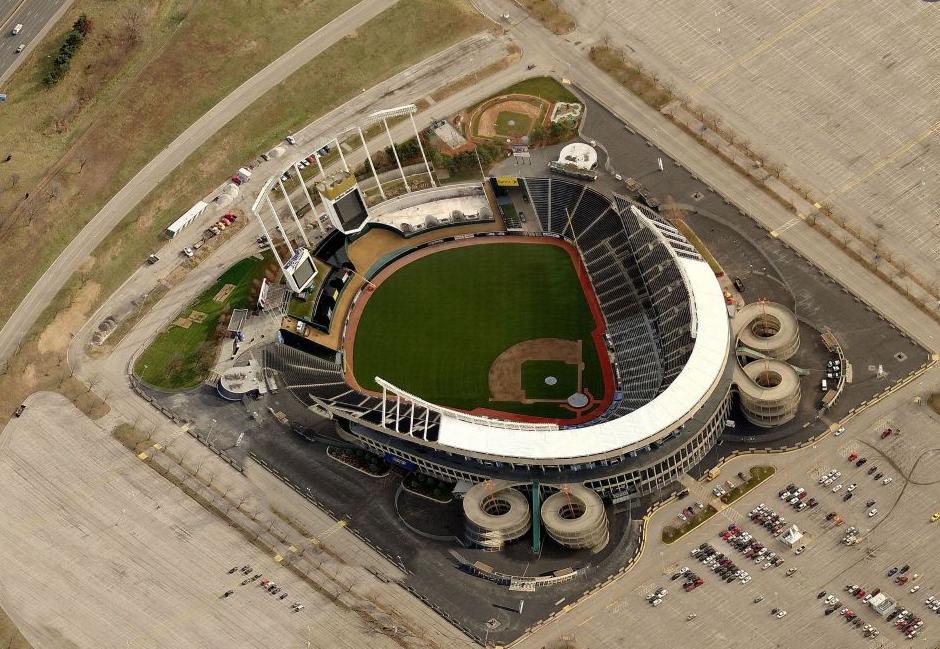
Kauffman Stadium
First pitch 7:40p
· roof open
Park 0.93×
Wind 2 mph cross
83°F
open
-5
4 mph · in
78°F
7:40p
Suppress for HR environment
-5
4 mph · in
78°F
8:40p
Suppress for HR environment
-5
4 mph · in
78°F
9:40p
Suppress for HR environment
-5
4 mph · in
78°F
10:40p
Suppress for HR environment
-5
4 mph · in
78°F
11:40p
Suppress for HR environment
⚪ Elevated · Combined 1.02
83°F, wind 2 mph SSE (cross) — modifier: +1. Park, wind, temperature, and roof are inputs to Combined, not separate signals to stack on top.

9 batters
| # | Batter | Score | Tier | Odds | Form | Rank | ISO ?Isolated Power — career SLG minus AVG. >.220 elite, .180–.220 above avg, <.140 below avg. | EV ?Avg Exit Velocity (mph) — Statcast season-to-date. >92 elite, 89–92 above avg, <86 below avg. | Barrel% ?Barrel rate vs. this pitch mix — percentage of contact classified as barrels (perfect EV + LA combo). >12% elite, 8–12% above avg. | HR/FB ?Batter HR / Fly Ball rate for this matchup. A vs LHP/vs RHP chip means a handedness split is shown; otherwise the value is overall. | HR Dist ?Average distance (ft) of this batter's HRs. >400ft elite raw power, 380–400 above avg. | Sea HR% ?Season HR rate (HRs / PAs so far this year). v3.5 model feature — top backtest contributor. | 14d Pace ?Recent 14-day HR pace (HRs / games started). v3.5 model feature — captures current form. | Match% ?HR/FB Matchup — combined batter × pitcher HR/FB rate. The headline "how favorable is this matchup" number. | BBE ?Sample size — batted-ball events. <30 = small sample, treat stats with caution. | |
|---|---|---|---|---|---|---|---|---|---|---|---|---|---|---|---|---|
| 1 |

|
Corey Seager | 56 | 🟠 C | · | · | 49 | 0.185 | 91.0 | 10.6% | 23.3% vs RHP | 395 | 15.9% | 50.0% | 14.0% | 7 |
| 2 |

|
Joc Pederson | 55 | 🟠 C | · | 🌤️ WARM | 51 | 0.210 | 91.7 | 8.2% | 22.2% vs RHP | 386 | 14.0% | 33.3% | 21.2% | 37 |
| 3 |

|
Josh Jung | 46 | ⚪ D | · | 🌧️ COOL | 106 | 0.169 | 89.3 | 6.4% | 17.6% vs RHP | 387 | 13.8% | 25.0% | 18.0% | 40 |
| 4 |

|
Jake Burger | 45 | ⚪ D | · | 🌧️ COOL | 110 | 0.184 | 90.2 | 8.0% | 23.5% vs RHP | 393 | 13.8% | 0.0% | 13.9% | 31 |
| 5 |

|
Wyatt Langford | 43 | ⚪ D | · | 🌤️ WARM | 117 | 0.143 | 90.4 | 7.2% | 6.7% vs RHP | 373 | 5.6% | 50.0% | 10.7% | 7 |
| 6 |

|
Brandon Nimmo | 43 | ⚪ D | · | · | 119 | 0.156 | 91.7 | 9.2% | 14.9% vs RHP | 411 | 10.2% | 8.3% | 8.5% | 32 |
| 7 |

|
Kyle Higashioka | 42 | ⚪ D | · | · | 126 | 0.165 | 89.1 | 8.9% | 17.6% vs RHP | 401 | 9.1% | 0.0% | 13.8% | 17 |
| 8 |

|
Evan Carter | 40 | ⚪ D | · | ❄ COLD | 144 | 0.150 | 87.9 | 7.3% | 13.6% vs RHP | 368 | 12.2% | 11.1% | 10.2% | 16 |
| 9 |

|
Ezequiel Duran | 38 | ⚪ D | · | ❄ COLD | 158 | 0.164 | 90.3 | 6.4% | 13.0% vs RHP | 370 | 8.3% | 0.0% | 10.8% | 33 |

6 batters
| # | Batter | Score | Tier | Odds | Form | Rank | ISO ?Isolated Power — career SLG minus AVG. >.220 elite, .180–.220 above avg, <.140 below avg. | EV ?Avg Exit Velocity (mph) — Statcast season-to-date. >92 elite, 89–92 above avg, <86 below avg. | Barrel% ?Barrel rate vs. this pitch mix — percentage of contact classified as barrels (perfect EV + LA combo). >12% elite, 8–12% above avg. | HR/FB ?Batter HR / Fly Ball rate for this matchup. A vs LHP/vs RHP chip means a handedness split is shown; otherwise the value is overall. | HR Dist ?Average distance (ft) of this batter's HRs. >400ft elite raw power, 380–400 above avg. | Sea HR% ?Season HR rate (HRs / PAs so far this year). v3.5 model feature — top backtest contributor. | 14d Pace ?Recent 14-day HR pace (HRs / games started). v3.5 model feature — captures current form. | Match% ?HR/FB Matchup — combined batter × pitcher HR/FB rate. The headline "how favorable is this matchup" number. | BBE ?Sample size — batted-ball events. <30 = small sample, treat stats with caution. | |
|---|---|---|---|---|---|---|---|---|---|---|---|---|---|---|---|---|
| 1 |

|
Michael Massey | 53 | 🟠 C | · | 🌧️ COOL | 58 | 0.197 | 91.1 | 8.3% | 11.1% vs RHP | 393 | 8.6% | 33.3% | 20.3% | 29 |
| 2 |

|
Carter Jensen | 47 | ⚪ D | · | 🌤️ WARM | 95 | 0.162 | 90.1 | 8.4% | 17.0% vs RHP | 384 | 13.3% | 20.0% | 15.0% | 29 |
| 3 |

|
Jac Caglianone | 47 | ⚪ D | · | 🌧️ COOL | 99 | 0.149 | 93.9 | 10.9% | 16.0% vs RHP | 410 | 9.1% | 9.1% | 9.7% | 24 |
| 4 |

|
Vinnie Pasquantino | 38 | ⚪ D | · | · | 154 | 0.127 | 88.7 | 7.5% | 14.0% vs RHP | 395 | 10.0% | 8.3% | 8.3% | 40 |
| 5 |

|
Isaac Collins | 31 | ⚪ D | · | ❄ COLD | 191 | 0.088 | 88.0 | 7.5% | 8.3% vs RHP | 377 | 5.6% | 0.0% | 7.7% | 22 |
| 6 |

|
Kyle Isbel | 29 | ⚪ D | · | ❄ COLD | 201 | 0.107 | 88.5 | 4.9% | 15.0% vs RHP | 390 | 5.6% | 0.0% | 8.5% | 24 |