 CHC
CHC
@
8:40p
 COL
COL
Stadium Conditions
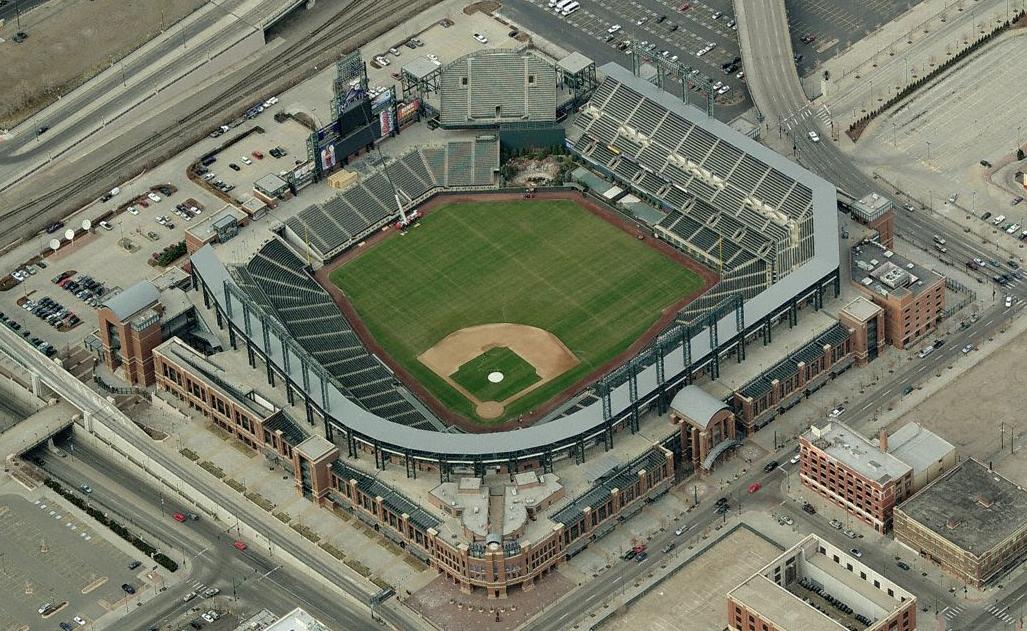
Coors Field
First pitch 8:40p
· roof open
Park 1.13×
Wind 7 mph cross
82°F
open
+12
11 mph · slight_out
82°F
8:40p
Boost for HR environment
+12
11 mph · slight_out
82°F
9:40p
Boost for HR environment
+12
11 mph · slight_out
82°F
10:40p
Boost for HR environment
+12
11 mph · slight_out
82°F
11:40p
Boost for HR environment
+12
11 mph · slight_out
82°F
12:40a
Boost for HR environment
⚪ Boost · Combined 1.24
81°F, wind 7 mph W (cross) — modifier: +1. Park, wind, temperature, and roof are inputs to Combined, not separate signals to stack on top.

9 batters
| # | Batter | Score | Tier | Odds | Form | Rank | ISO ?Isolated Power — career SLG minus AVG. >.220 elite, .180–.220 above avg, <.140 below avg. | EV ?Avg Exit Velocity (mph) — Statcast season-to-date. >92 elite, 89–92 above avg, <86 below avg. | Barrel% ?Barrel rate vs. this pitch mix — percentage of contact classified as barrels (perfect EV + LA combo). >12% elite, 8–12% above avg. | HR/FB ?Batter HR / Fly Ball rate for this matchup. A vs LHP/vs RHP chip means a handedness split is shown; otherwise the value is overall. | HR Dist ?Average distance (ft) of this batter's HRs. >400ft elite raw power, 380–400 above avg. | Sea HR% ?Season HR rate (HRs / PAs so far this year). v3.5 model feature — top backtest contributor. | 14d Pace ?Recent 14-day HR pace (HRs / games started). v3.5 model feature — captures current form. | Match% ?HR/FB Matchup — combined batter × pitcher HR/FB rate. The headline "how favorable is this matchup" number. | BBE ?Sample size — batted-ball events. <30 = small sample, treat stats with caution. | |
|---|---|---|---|---|---|---|---|---|---|---|---|---|---|---|---|---|
| 1 |

|
Ian Happ | 87 | 🟢 A | +550 | 🌤️ WARM | 1 | 0.259 | 90.7 | 16.0% | 33.3% vs RHP | 402 | 23.8% | 33.3% | 38.3% | 34 |
| 2 |

|
Pete Crow-Armstrong | 72 | 🟡 B | +410 | 🔥 HOT | 7 | 0.179 | 91.9 | 13.8% | 18.6% vs RHP | 392 | 15.6% | 33.3% | 24.0% | 37 |
| 3 |

|
Seiya Suzuki | 62 | 🔵 C+ | +650 | 🔥 HOT | 24 | 0.169 | 89.2 | 11.9% | 24.1% vs RHP | 410 | 11.4% | 18.2% | 15.3% | 33 |
| 4 |

|
Miguel Amaya | 62 | 🔵 C+ | · | 🌧️ COOL | 27 | 0.213 | 85.8 | 11.0% | 27.8% vs RHP | 384 | 10.0% | 0.0% | 16.4% | 9 |
| 5 |

|
Moises Ballesteros | 58 | 🟠 C | +575 | ❄ COLD | 42 | 0.175 | 90.8 | 12.8% | 22.2% vs RHP | 390 | 0.0% | 0.0% | 14.5% | 14 |
| 6 |

|
Michael Busch | 58 | 🟠 C | +525 | ❄ COLD | 43 | 0.150 | 88.2 | 13.3% | 12.5% vs RHP | 398 | 9.2% | 0.0% | 11.0% | 30 |
| 7 |

|
Dansby Swanson | 53 | 🟠 C | +600 | 🌧️ COOL | 62 | 0.133 | 89.5 | 10.8% | 11.1% vs RHP | 398 | 11.3% | 0.0% | 8.3% | 21 |
| 8 |

|
Alex Bregman | 51 | 🟠 C | +800 | ❄ COLD | 73 | 0.136 | 88.3 | 9.2% | 16.7% vs RHP | 392 | 6.3% | 8.3% | 9.2% | 41 |
| 9 |

|
Nico Hoerner ⚡ | 38 | ⚪ D | · | 🌤️ WARM | 153 | 0.101 | 85.9 | 4.4% | 5.0% vs RHP | 383 | 6.2% | 0.0% | 7.4% | 48 |

8 batters
| # | Batter | Score | Tier | Odds | Form | Rank | ISO ?Isolated Power — career SLG minus AVG. >.220 elite, .180–.220 above avg, <.140 below avg. | EV ?Avg Exit Velocity (mph) — Statcast season-to-date. >92 elite, 89–92 above avg, <86 below avg. | Barrel% ?Barrel rate vs. this pitch mix — percentage of contact classified as barrels (perfect EV + LA combo). >12% elite, 8–12% above avg. | HR/FB ?Batter HR / Fly Ball rate for this matchup. A vs LHP/vs RHP chip means a handedness split is shown; otherwise the value is overall. | HR Dist ?Average distance (ft) of this batter's HRs. >400ft elite raw power, 380–400 above avg. | Sea HR% ?Season HR rate (HRs / PAs so far this year). v3.5 model feature — top backtest contributor. | 14d Pace ?Recent 14-day HR pace (HRs / games started). v3.5 model feature — captures current form. | Match% ?HR/FB Matchup — combined batter × pitcher HR/FB rate. The headline "how favorable is this matchup" number. | BBE ?Sample size — batted-ball events. <30 = small sample, treat stats with caution. | |
|---|---|---|---|---|---|---|---|---|---|---|---|---|---|---|---|---|
| 1 |

|
Hunter Goodman | 83 | 🟢 A | +800 | 🌤️ WARM | 2 | 0.276 | 91.0 | 13.5% | 36.8% vs RHP | 402 | 25.5% | 54.5% | 37.1% | 29 |
| 2 |

|
Kyle Karros | 49 | ⚪ D | +1000 | 🔥 HOT | 79 | 0.117 | 89.9 | 8.9% | 12.5% vs RHP | 408 | 6.2% | 20.0% | 14.6% | 25 |
| 3 |

|
Ezequiel Tovar | 49 | ⚪ D | · | 🌤️ WARM | 82 | 0.132 | 87.9 | 9.8% | 15.8% vs RHP | 420 | 5.2% | 9.1% | 14.2% | 27 |
| 4 |

|
Jake Mccarthy | 47 | ⚪ D | · | 🌤️ WARM | 94 | 0.164 | 84.6 | 8.3% | 14.3% vs RHP | 418 | 0.0% | 0.0% | 13.8% | 33 |
| 5 |

|
Tj Rumfield | 47 | ⚪ D | · | ❄ COLD | 98 | 0.155 | 85.3 | 9.2% | 18.6% vs RHP | 412 | 0.0% | 0.0% | 11.2% | 25 |
| 6 |

|
Edouard Julien | 43 | ⚪ D | · | 🌧️ COOL | 122 | 0.109 | 90.7 | 8.9% | 13.6% vs RHP | 389 | 3.6% | 0.0% | 8.9% | 15 |
| 7 |

|
Willi Castro | 42 | ⚪ D | · | 🌧️ COOL | 130 | 0.098 | 88.8 | 8.1% | 9.4% vs RHP | 415 | 4.4% | 10.0% | 8.4% | 29 |
| 8 |

|
Troy Johnston | 41 | ⚪ D | +1000 | 🌤️ WARM | 135 | 0.143 | 89.0 | 5.9% | 11.1% vs RHP | 415 | 0.0% | 0.0% | 9.3% | 41 |