 STL
STL
@
7:40p
 KC
KC
Stadium Conditions
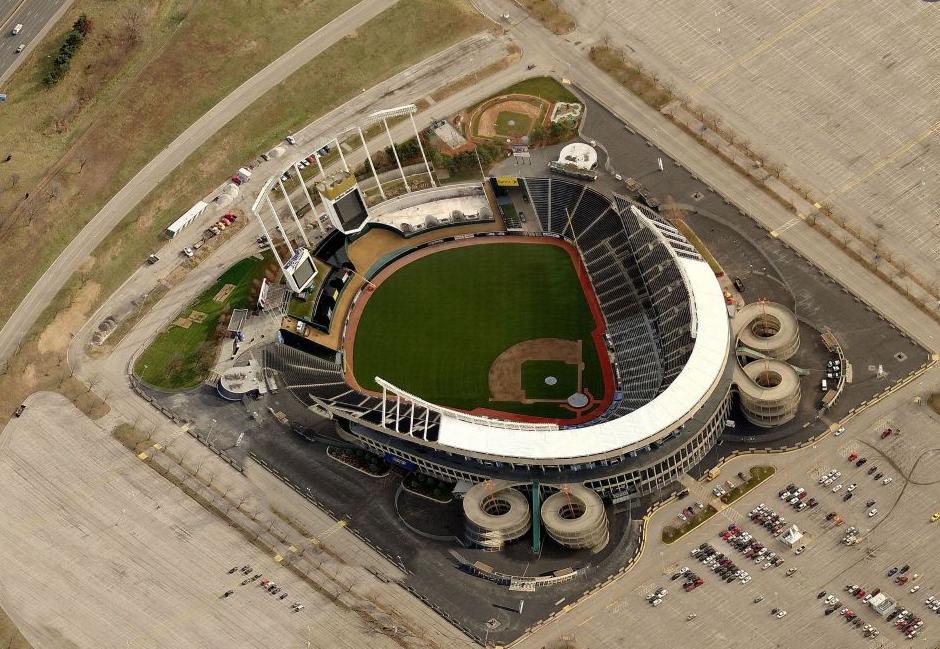
Kauffman Stadium
First pitch 7:40p
· roof open
Park 0.92×
Wind 2 mph slight_out
72°F
open
-6
4 mph · in
78°F
7:40p
Suppress for HR environment
-6
4 mph · in
78°F
8:40p
Suppress for HR environment
-6
4 mph · in
78°F
9:40p
Suppress for HR environment
-6
4 mph · in
78°F
10:40p
Suppress for HR environment
-6
4 mph · in
78°F
11:40p
Suppress for HR environment
⚪ Soft suppress · Combined 0.92
72°F, wind 2 mph NNW (slight_out) — modifier: +0. Park, wind, temperature, and roof are inputs to Combined, not separate signals to stack on top.

8 batters
| # | Batter | Score | Tier | Odds | Form | Rank | ISO ?Isolated Power — career SLG minus AVG. >.220 elite, .180–.220 above avg, <.140 below avg. | EV ?Avg Exit Velocity (mph) — Statcast season-to-date. >92 elite, 89–92 above avg, <86 below avg. | Barrel% ?Barrel rate vs. this pitch mix — percentage of contact classified as barrels (perfect EV + LA combo). >12% elite, 8–12% above avg. | HR/FB ?Batter HR / Fly Ball rate for this matchup. A vs LHP/vs RHP chip means a handedness split is shown; otherwise the value is overall. | HR Dist ?Average distance (ft) of this batter's HRs. >400ft elite raw power, 380–400 above avg. | Sea HR% ?Season HR rate (HRs / PAs so far this year). v3.5 model feature — top backtest contributor. | 14d Pace ?Recent 14-day HR pace (HRs / games started). v3.5 model feature — captures current form. | Match% ?HR/FB Matchup — combined batter × pitcher HR/FB rate. The headline "how favorable is this matchup" number. | BBE ?Sample size — batted-ball events. <30 = small sample, treat stats with caution. | |
|---|---|---|---|---|---|---|---|---|---|---|---|---|---|---|---|---|
| 1 |

|
Jordan Walker ⚡ | 65 | 🔵 C+ | +600 | 🌤️ WARM | 18 | 0.257 | 94.7 | 11.5% | 42.9% vs LHP | 408 | 20.0% | 25.0% | 25.3% | 42 |
| 2 |

|
Alec Burleson | 58 | 🟠 C | +700 | 🔥 HOT | 26 | 0.204 | 91.6 | 10.5% | 4.8% vs LHP | 405 | 18.6% | 50.0% | 18.7% | 44 |
| 3 |

|
Nelson Velazquez | 54 | 🟠 C | +625 | 🌤️ WARM | 33 | 0.242 | 93.4 | 12.1% | 40.0% vs LHP | 407 | 0.0% | 0.0% | 28.6% | 9 |
| 4 |

|
Ivan Herrera | 37 | ⚪ D | · | · | 92 | 0.169 | 89.7 | 8.1% | 35.7% vs LHP | 405 | 0.0% | 0.0% | 12.8% | 36 |
| 5 |

|
Jj Wetherholt | 34 | ⚪ D | +950 | 🌧️ COOL | 104 | 0.139 | 90.5 | 8.5% | 8.3% vs LHP | 392 | 0.0% | 0.0% | 8.1% | 33 |
| 6 |

|
Pedro Pages | 32 | ⚪ D | · | 🌤️ WARM | 112 | 0.142 | 87.1 | 7.6% | 0.0% vs LHP | 403 | 0.0% | 0.0% | 7.4% | 5 |
| 7 |

|
Masyn Winn | 23 | ⚪ D | · | 🌤️ WARM | 128 | 0.079 | 87.1 | 5.5% | 0.0% vs LHP | 379 | 3.0% | 0.0% | 5.4% | 33 |
| 8 |

|
José Fermín | 21 | ⚪ D | · | 🌧️ COOL | 131 | 0.105 | 85.6 | 3.3% | 11.1% vs LHP | 372 | 0.0% | 0.0% | 6.7% | 22 |

7 batters
| # | Batter | Score | Tier | Odds | Form | Rank | ISO ?Isolated Power — career SLG minus AVG. >.220 elite, .180–.220 above avg, <.140 below avg. | EV ?Avg Exit Velocity (mph) — Statcast season-to-date. >92 elite, 89–92 above avg, <86 below avg. | Barrel% ?Barrel rate vs. this pitch mix — percentage of contact classified as barrels (perfect EV + LA combo). >12% elite, 8–12% above avg. | HR/FB ?Batter HR / Fly Ball rate for this matchup. A vs LHP/vs RHP chip means a handedness split is shown; otherwise the value is overall. | HR Dist ?Average distance (ft) of this batter's HRs. >400ft elite raw power, 380–400 above avg. | Sea HR% ?Season HR rate (HRs / PAs so far this year). v3.5 model feature — top backtest contributor. | 14d Pace ?Recent 14-day HR pace (HRs / games started). v3.5 model feature — captures current form. | Match% ?HR/FB Matchup — combined batter × pitcher HR/FB rate. The headline "how favorable is this matchup" number. | BBE ?Sample size — batted-ball events. <30 = small sample, treat stats with caution. | |
|---|---|---|---|---|---|---|---|---|---|---|---|---|---|---|---|---|
| 1 |

|
Jac Caglianone | 52 | 🟠 C | +525 | · | 41 | 0.164 | 93.6 | 12.0% | 27.3% vs LHP | 414 | 9.4% | 8.3% | 18.5% | 30 |
| 2 |

|
Michael Massey | 52 | 🟠 C | +900 | · | 43 | 0.191 | 91.0 | 9.1% | 9.8% | 393 | 9.8% | 22.2% | 14.8% | 35 |
| 3 |

|
Carter Jensen | 49 | ⚪ D | +700 | 🌤️ WARM | 49 | 0.162 | 90.7 | 9.4% | 0.0% vs LHP | 384 | 13.5% | 18.2% | 9.9% | 37 |
| 4 |

|
Lane Thomas ⚡ | 41 | ⚪ D | +850 | 🔥 HOT | 79 | 0.107 | 86.9 | 6.1% | 5.9% vs LHP | 416 | 16.2% | 37.5% | 11.1% | 25 |
| 5 |

|
Starling Marte | 41 | ⚪ D | +950 | 🌧️ COOL | 82 | 0.072 | 91.6 | 11.6% | 0.0% vs LHP | 441 | 4.2% | 25.0% | 9.8% | 12 |
| 6 |

|
Nick Loftin | 37 | ⚪ D | · | 🌤️ WARM | 93 | 0.146 | 86.8 | 7.5% | 0.0% vs LHP | 381 | 5.0% | 0.0% | 6.5% | 23 |
| 7 |

|
Isaac Collins | 32 | ⚪ D | +900 | ❄ COLD | 113 | 0.082 | 88.8 | 8.3% | 7.7% vs LHP | 377 | 4.9% | 0.0% | 6.8% | 34 |