 LAD
LAD
@
6:40p
 PIT
PIT
Stadium Conditions
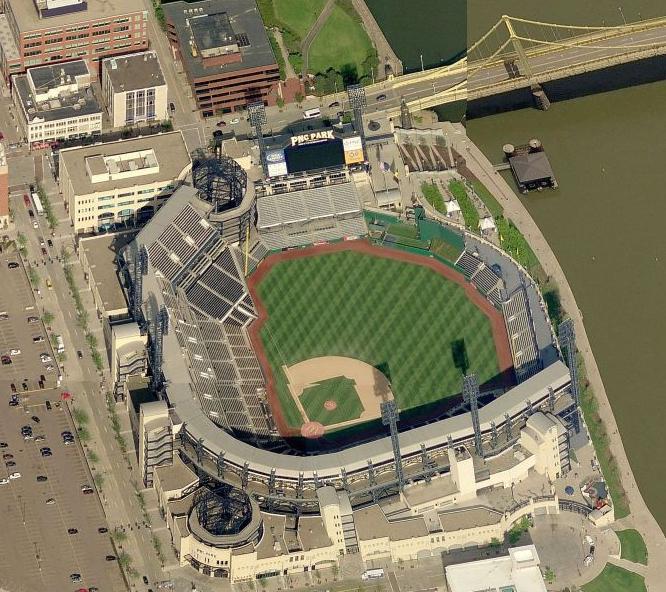
PNC Park
First pitch 6:40p
· roof open
Park 0.86×
Wind 10 mph slight_out
88°F
open
+5
9 mph · out
75°F
6:40p
Boost for HR environment
+5
9 mph · out
75°F
7:40p
Boost for HR environment
+5
9 mph · out
75°F
8:40p
Boost for HR environment
+5
9 mph · out
75°F
9:40p
Boost for HR environment
+5
9 mph · out
75°F
10:40p
Boost for HR environment
⚪ Boost · Combined 1.12
88°F, wind 10 mph WSW (slight_out) — modifier: +3. Park, wind, temperature, and roof are inputs to Combined, not separate signals to stack on top.

8 batters
| # | Batter | Score | Tier | Odds | Form | Rank | ISO ?Isolated Power — career SLG minus AVG. >.220 elite, .180–.220 above avg, <.140 below avg. | EV ?Avg Exit Velocity (mph) — Statcast season-to-date. >92 elite, 89–92 above avg, <86 below avg. | Barrel% ?Barrel rate vs. this pitch mix — percentage of contact classified as barrels (perfect EV + LA combo). >12% elite, 8–12% above avg. | HR/FB ?Batter HR / Fly Ball rate for this matchup. A vs LHP/vs RHP chip means a handedness split is shown; otherwise the value is overall. | HR Dist ?Average distance (ft) of this batter's HRs. >400ft elite raw power, 380–400 above avg. | Sea HR% ?Season HR rate (HRs / PAs so far this year). v3.5 model feature — top backtest contributor. | 14d Pace ?Recent 14-day HR pace (HRs / games started). v3.5 model feature — captures current form. | Match% ?HR/FB Matchup — combined batter × pitcher HR/FB rate. The headline "how favorable is this matchup" number. | BBE ?Sample size — batted-ball events. <30 = small sample, treat stats with caution. | |
|---|---|---|---|---|---|---|---|---|---|---|---|---|---|---|---|---|
| 1 |

|
Max Muncy | 55 | 🟠 C | · | 🌧️ COOL | 32 | 0.247 | 91.0 | 10.5% | 28.3% vs RHP | 408 | 17.6% | 15.4% | 17.1% | 35 |
| 2 |

|
Shohei Ohtani | 53 | 🟠 C | +650 | · | 37 | 0.219 | 93.4 | 10.1% | 18.4% vs RHP | 402 | 14.1% | 25.0% | 20.0% | 34 |
| 3 |

|
Dalton Rushing | 53 | 🟠 C | · | 🌧️ COOL | 39 | 0.262 | 88.3 | 8.1% | 41.2% vs RHP | 396 | 11.1% | 25.0% | 16.6% | 22 |
| 4 |

|
Andy Pages | 50 | 🟠 C | · | 🌧️ COOL | 53 | 0.236 | 89.7 | 8.1% | 27.5% vs RHP | 390 | 18.8% | 18.2% | 12.2% | 41 |
| 5 |

|
Freddie Freeman | 47 | ⚪ D | · | 🌧️ COOL | 63 | 0.193 | 91.0 | 8.8% | 18.6% vs RHP | 395 | 12.7% | 25.0% | 15.5% | 41 |
| 6 |

|
Mookie Betts | 34 | ⚪ D | · | 🌧️ COOL | 101 | 0.166 | 90.0 | 7.6% | 15.4% vs RHP | 388 | 4.0% | 0.0% | 7.5% | 37 |
| 7 |

|
Kyle Tucker | 30 | ⚪ D | · | · | 107 | 0.140 | 89.0 | 5.9% | 10.0% vs RHP | 403 | 4.7% | 8.3% | 6.7% | 30 |
| 8 |

|
Alex Freeland ⚡ | 30 | ⚪ D | · | · | 108 | 0.125 | 89.1 | 7.0% | 12.5% vs RHP | 373 | 4.4% | 8.3% | 6.6% | 21 |

7 batters
| # | Batter | Score | Tier | Odds | Form | Rank | ISO ?Isolated Power — career SLG minus AVG. >.220 elite, .180–.220 above avg, <.140 below avg. | EV ?Avg Exit Velocity (mph) — Statcast season-to-date. >92 elite, 89–92 above avg, <86 below avg. | Barrel% ?Barrel rate vs. this pitch mix — percentage of contact classified as barrels (perfect EV + LA combo). >12% elite, 8–12% above avg. | HR/FB ?Batter HR / Fly Ball rate for this matchup. A vs LHP/vs RHP chip means a handedness split is shown; otherwise the value is overall. | HR Dist ?Average distance (ft) of this batter's HRs. >400ft elite raw power, 380–400 above avg. | Sea HR% ?Season HR rate (HRs / PAs so far this year). v3.5 model feature — top backtest contributor. | 14d Pace ?Recent 14-day HR pace (HRs / games started). v3.5 model feature — captures current form. | Match% ?HR/FB Matchup — combined batter × pitcher HR/FB rate. The headline "how favorable is this matchup" number. | BBE ?Sample size — batted-ball events. <30 = small sample, treat stats with caution. | |
|---|---|---|---|---|---|---|---|---|---|---|---|---|---|---|---|---|
| 1 |

|
Brandon Lowe | 52 | 🟠 C | · | 🌧️ COOL | 42 | 0.260 | 90.0 | 9.3% | 27.3% vs LHP | 393 | 14.5% | 9.1% | 15.4% | 29 |
| 2 |

|
Spencer Horwitz | 43 | ⚪ D | · | 🌤️ WARM | 74 | 0.184 | 86.3 | 7.6% | 13.2% | 391 | 13.0% | 27.3% | 15.1% | 39 |
| 3 |

|
Bryan Reynolds | 41 | ⚪ D | · | 🌤️ WARM | 83 | 0.164 | 90.8 | 8.0% | 23.1% vs LHP | 415 | 11.5% | 25.0% | 12.8% | 32 |
| 4 |

|
Marcell Ozuna | 27 | ⚪ D | · | ❄ COLD | 115 | 0.102 | 89.6 | 7.6% | 20.0% vs LHP | 408 | 7.1% | 0.0% | 5.9% | 9 |
| 5 |

|
Nick Gonzales | 21 | ⚪ D | · | 🌤️ WARM | 121 | 0.077 | 85.6 | 4.8% | 0.0% vs LHP | 389 | 3.4% | 16.7% | 4.6% | 37 |
| 6 |

|
Jake Mangum | 15 | ⚪ D | · | 🌤️ WARM | 125 | 0.047 | 84.0 | 2.7% | 5.6% | 410 | 4.2% | 16.7% | 4.8% | 31 |
| 7 |

|
Jared Triolo | 12 | ⚪ D | +900 | 🌧️ COOL | 127 | 0.046 | 87.0 | 3.1% | 0.0% | 0 | 0.0% | 0.0% | 4.2% | 27 |