 HOU
HOU
@
2:10p
 KC
KC
Stadium Conditions
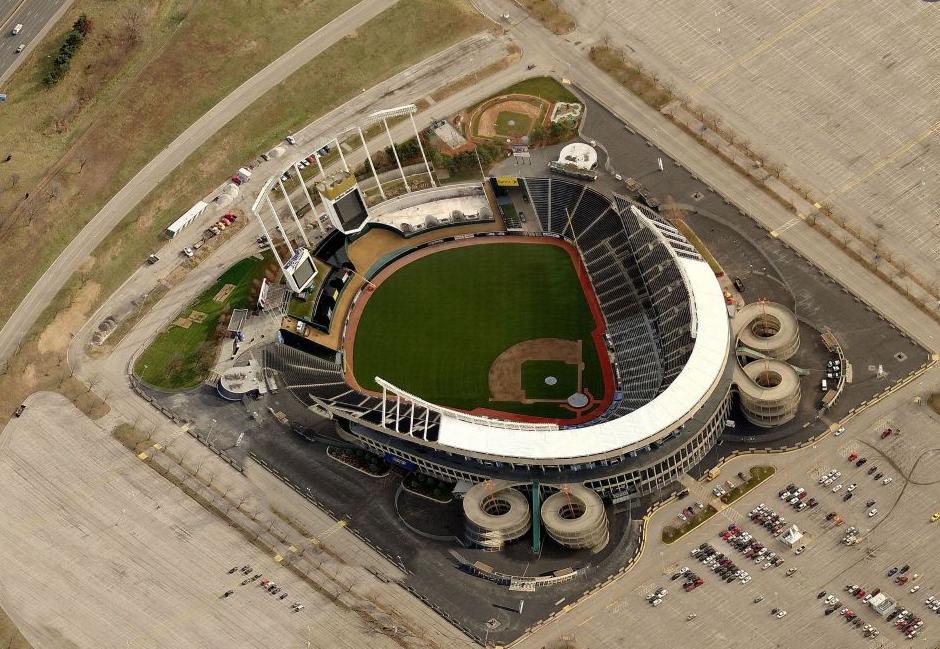
Kauffman Stadium
First pitch 2:10p
· roof open
Park 1.00×
Wind 8 mph slight_out
74°F
open
-3
4 mph · in
78°F
2:10p
Neutral for HR environment
-3
4 mph · in
78°F
3:10p
Neutral for HR environment
-3
4 mph · in
78°F
4:10p
Neutral for HR environment
-3
4 mph · in
78°F
5:10p
Neutral for HR environment
-3
4 mph · in
78°F
6:10p
Neutral for HR environment
⚪ Boost · Combined 1.10
74°F, wind 8 mph NW (slight_out) — modifier: +1. Park, wind, temperature, and roof are inputs to Combined, not separate signals to stack on top.

6 batters
| # | Batter | Score | Tier | Odds | Form | Rank | ISO ?Isolated Power — career SLG minus AVG. >.220 elite, .180–.220 above avg, <.140 below avg. | EV ?Avg Exit Velocity (mph) — Statcast season-to-date. >92 elite, 89–92 above avg, <86 below avg. | Barrel% ?Barrel rate vs. this pitch mix — percentage of contact classified as barrels (perfect EV + LA combo). >12% elite, 8–12% above avg. | HR/FB ?Batter HR / Fly Ball rate for this matchup. A vs LHP/vs RHP chip means a handedness split is shown; otherwise the value is overall. | HR Dist ?Average distance (ft) of this batter's HRs. >400ft elite raw power, 380–400 above avg. | Sea HR% ?Season HR rate (HRs / PAs so far this year). v3.5 model feature — top backtest contributor. | 14d Pace ?Recent 14-day HR pace (HRs / games started). v3.5 model feature — captures current form. | Match% ?HR/FB Matchup — combined batter × pitcher HR/FB rate. The headline "how favorable is this matchup" number. | BBE ?Sample size — batted-ball events. <30 = small sample, treat stats with caution. | |
|---|---|---|---|---|---|---|---|---|---|---|---|---|---|---|---|---|
| 1 |

|
Christian Walker | 63 | 🔵 C+ | · | 🌧️ COOL | 34 | 0.259 | 90.6 | 9.0% | 32.6% vs RHP | 390 | 23.5% | 16.7% | 24.9% | 33 |
| 2 |

|
Brice Matthews | 46 | ⚪ D | · | 🌧️ COOL | 108 | 0.129 | 88.3 | 7.9% | 11.1% vs RHP | 410 | 12.1% | 33.3% | 14.3% | 15 |
| 3 |

|
Cam Smith | 45 | ⚪ D | · | 🌤️ WARM | 112 | 0.140 | 89.4 | 9.6% | 15.6% vs RHP | 415 | 10.8% | 9.1% | 9.6% | 28 |
| 4 |

|
Jake Meyers | 37 | ⚪ D | · | ❄ COLD | 169 | 0.104 | 85.7 | 7.0% | 13.3% vs RHP | 400 | 11.1% | 12.5% | 8.8% | 28 |
| 5 |

|
Jeremy Peña | 33 | ⚪ D | · | · | 182 | 0.129 | 85.8 | 5.5% | 8.0% vs RHP | 423 | 4.2% | 0.0% | 8.1% | 35 |
| 6 |

|
Joey Loperfido | 26 | ⚪ D | · | 🌤️ WARM | 217 | 0.069 | 90.4 | 5.5% | 0.0% vs RHP | 0 | 0.0% | 0.0% | 7.4% | 4 |

5 batters
| # | Batter | Score | Tier | Odds | Form | Rank | ISO ?Isolated Power — career SLG minus AVG. >.220 elite, .180–.220 above avg, <.140 below avg. | EV ?Avg Exit Velocity (mph) — Statcast season-to-date. >92 elite, 89–92 above avg, <86 below avg. | Barrel% ?Barrel rate vs. this pitch mix — percentage of contact classified as barrels (perfect EV + LA combo). >12% elite, 8–12% above avg. | HR/FB ?Batter HR / Fly Ball rate for this matchup. A vs LHP/vs RHP chip means a handedness split is shown; otherwise the value is overall. | HR Dist ?Average distance (ft) of this batter's HRs. >400ft elite raw power, 380–400 above avg. | Sea HR% ?Season HR rate (HRs / PAs so far this year). v3.5 model feature — top backtest contributor. | 14d Pace ?Recent 14-day HR pace (HRs / games started). v3.5 model feature — captures current form. | Match% ?HR/FB Matchup — combined batter × pitcher HR/FB rate. The headline "how favorable is this matchup" number. | BBE ?Sample size — batted-ball events. <30 = small sample, treat stats with caution. | |
|---|---|---|---|---|---|---|---|---|---|---|---|---|---|---|---|---|
| 1 |

|
Jac Caglianone | 51 | 🟠 C | · | · | 80 | 0.169 | 93.7 | 9.6% | 18.5% vs RHP | 414 | 10.0% | 16.7% | 13.9% | 29 |
| 2 |

|
Michael Massey | 50 | 🟠 C | · | 🌧️ COOL | 85 | 0.194 | 90.9 | 6.8% | 10.6% vs RHP | 393 | 7.7% | 27.3% | 13.5% | 38 |
| 3 |

|
Carter Jensen | 45 | ⚪ D | · | · | 116 | 0.163 | 90.2 | 7.5% | 17.0% vs RHP | 384 | 12.2% | 9.1% | 7.8% | 33 |
| 4 |

|
Lane Thomas ⚡ | 36 | ⚪ D | · | 🔥 HOT | 170 | 0.074 | 87.0 | 5.0% | 11.1% vs RHP | 416 | 12.1% | 33.3% | 12.6% | 23 |
| 5 |

|
Isaac Collins | 31 | ⚪ D | · | ❄ COLD | 193 | 0.087 | 88.5 | 6.7% | 7.4% vs RHP | 377 | 5.2% | 0.0% | 5.4% | 28 |