 TB
TB
@
9:38p
 LAA
LAA
Stadium Conditions
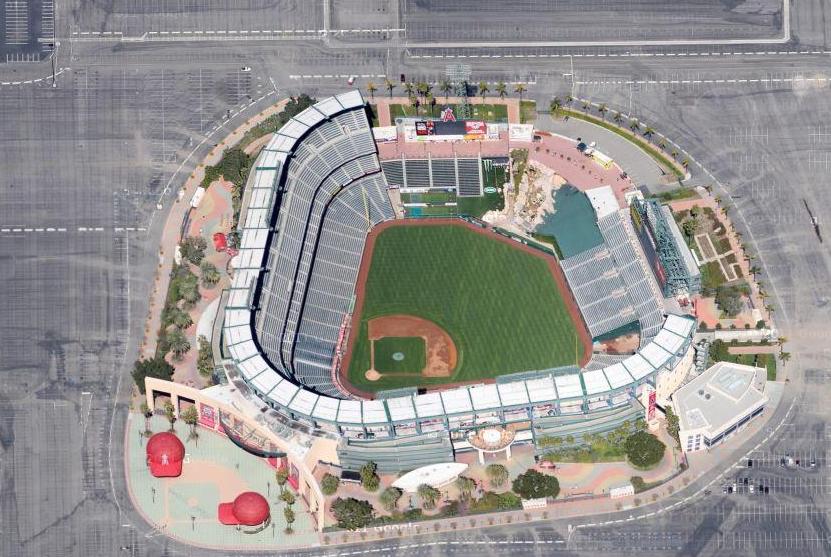
Angel Stadium
First pitch 9:38p
· roof open
Park 1.07×
Wind 10 mph in
90°F
open
-8
11 mph · in
79°F
9:38p
Suppress for HR environment
-8
11 mph · in
79°F
10:38p
Suppress for HR environment
-8
11 mph · in
79°F
11:38p
Suppress for HR environment
-8
11 mph · in
79°F
12:38a
Suppress for HR environment
-8
11 mph · in
79°F
1:38a
Suppress for HR environment
⚪ Elevated · Combined 1.07
90°F, wind 10 mph WSW (in) — modifier: +0. Park, wind, temperature, and roof are inputs to Combined, not separate signals to stack on top.

6 batters
| # | Batter | Score | Tier | Odds | Form | Rank | ISO ?Isolated Power — career SLG minus AVG. >.220 elite, .180–.220 above avg, <.140 below avg. | EV ?Avg Exit Velocity (mph) — Statcast season-to-date. >92 elite, 89–92 above avg, <86 below avg. | Barrel% ?Barrel rate vs. this pitch mix — percentage of contact classified as barrels (perfect EV + LA combo). >12% elite, 8–12% above avg. | HR/FB ?Batter HR / Fly Ball rate for this matchup. A vs LHP/vs RHP chip means a handedness split is shown; otherwise the value is overall. | HR Dist ?Average distance (ft) of this batter's HRs. >400ft elite raw power, 380–400 above avg. | Sea HR% ?Season HR rate (HRs / PAs so far this year). v3.5 model feature — top backtest contributor. | 14d Pace ?Recent 14-day HR pace (HRs / games started). v3.5 model feature — captures current form. | Match% ?HR/FB Matchup — combined batter × pitcher HR/FB rate. The headline "how favorable is this matchup" number. | BBE ?Sample size — batted-ball events. <30 = small sample, treat stats with caution. | |
|---|---|---|---|---|---|---|---|---|---|---|---|---|---|---|---|---|
| 1 |

|
Mike Trout | 65 | 🔵 C+ | +370 | 🌤️ WARM | 28 | 0.221 | 91.9 | 13.8% | 20.0% vs LHP | 408 | 17.5% | 16.7% | 19.6% | 28 |
| 2 |

|
Zach Neto | 60 | 🔵 C+ | +475 | 🌧️ COOL | 46 | 0.210 | 89.7 | 10.4% | 18.8% vs LHP | 400 | 17.5% | 25.0% | 21.4% | 22 |
| 3 |

|
Oswald Peraza | 46 | ⚪ D | +625 | · | 98 | 0.164 | 87.2 | 9.0% | 33.3% vs LHP | 386 | 10.6% | 8.3% | 11.6% | 39 |
| 4 |

|
Jo Adell | 46 | ⚪ D | +400 | 🌧️ COOL | 102 | 0.141 | 90.7 | 8.8% | 30.0% vs LHP | 415 | 12.7% | 16.7% | 10.5% | 37 |
| 5 |

|
Logan O'Hoppe | 43 | ⚪ D | +525 | 🌤️ WARM | 114 | 0.106 | 87.1 | 10.3% | 0.0% vs LHP | 411 | 3.6% | 28.6% | 9.8% | 21 |
| 6 |

|
Nolan Schanuel | 32 | ⚪ D | · | 🌧️ COOL | 187 | 0.118 | 87.0 | 5.2% | 12.5% vs LHP | 371 | 7.7% | 0.0% | 7.8% | 5 |

9 batters
| # | Batter | Score | Tier | Odds | Form | Rank | ISO ?Isolated Power — career SLG minus AVG. >.220 elite, .180–.220 above avg, <.140 below avg. | EV ?Avg Exit Velocity (mph) — Statcast season-to-date. >92 elite, 89–92 above avg, <86 below avg. | Barrel% ?Barrel rate vs. this pitch mix — percentage of contact classified as barrels (perfect EV + LA combo). >12% elite, 8–12% above avg. | HR/FB ?Batter HR / Fly Ball rate for this matchup. A vs LHP/vs RHP chip means a handedness split is shown; otherwise the value is overall. | HR Dist ?Average distance (ft) of this batter's HRs. >400ft elite raw power, 380–400 above avg. | Sea HR% ?Season HR rate (HRs / PAs so far this year). v3.5 model feature — top backtest contributor. | 14d Pace ?Recent 14-day HR pace (HRs / games started). v3.5 model feature — captures current form. | Match% ?HR/FB Matchup — combined batter × pitcher HR/FB rate. The headline "how favorable is this matchup" number. | BBE ?Sample size — batted-ball events. <30 = small sample, treat stats with caution. | |
|---|---|---|---|---|---|---|---|---|---|---|---|---|---|---|---|---|
| 1 |

|
Junior Caminero ⚡ | 59 | 🟠 C | +265 | · | 48 | 0.209 | 92.5 | 9.9% | 42.9% vs LHP | 408 | 21.0% | 8.3% | 13.7% | 35 |
| 2 |

|
Jonathan Aranda | 57 | 🟠 C | +475 | · | 55 | 0.190 | 90.8 | 9.7% | 9.1% vs LHP | 396 | 15.0% | 18.2% | 15.2% | 26 |
| 3 |

|
Yandy Diaz ⚡ | 49 | ⚪ D | +330 | · | 80 | 0.196 | 90.9 | 8.3% | 23.5% vs LHP | 385 | 0.0% | 0.0% | 18.2% | 44 |
| 4 |

|
Cedric Mullins | 42 | ⚪ D | · | 🌤️ WARM | 124 | 0.118 | 88.1 | 5.5% | 0.0% vs LHP | 386 | 10.0% | 27.3% | 9.5% | 25 |
| 5 |

|
Richie Palacios | 28 | ⚪ D | · | ❄ COLD | 206 | 0.078 | 87.1 | 4.8% | 3.1% | 382 | 0.0% | 0.0% | 6.0% | 26 |
| 6 |

|
Taylor Walls | 27 | ⚪ D | +850 | 🌤️ WARM | 207 | 0.069 | 83.3 | 4.7% | 0.0% vs LHP | 0 | 0.0% | 0.0% | 5.0% | 15 |
| 7 |

|
Nick Fortes | 26 | ⚪ D | +750 | 🌤️ WARM | 209 | 0.080 | 86.7 | 3.4% | 0.0% vs LHP | 408 | 0.0% | 0.0% | 5.0% | 29 |
| 8 |

|
Ben Williamson | 26 | ⚪ D | +950 | ❄ COLD | 212 | 0.080 | 88.5 | 2.7% | 11.1% vs LHP | 0 | 0.0% | 0.0% | 6.1% | 21 |
| 9 |

|
Chandler Simpson | 19 | ⚪ D | · | 🌧️ COOL | 229 | 0.061 | 84.0 | · | 0.0% vs LHP | 0 | 0.0% | 0.0% | 5.7% | 23 |