 PHI
PHI
@
6:45p
 WSH
WSH
Stadium Conditions
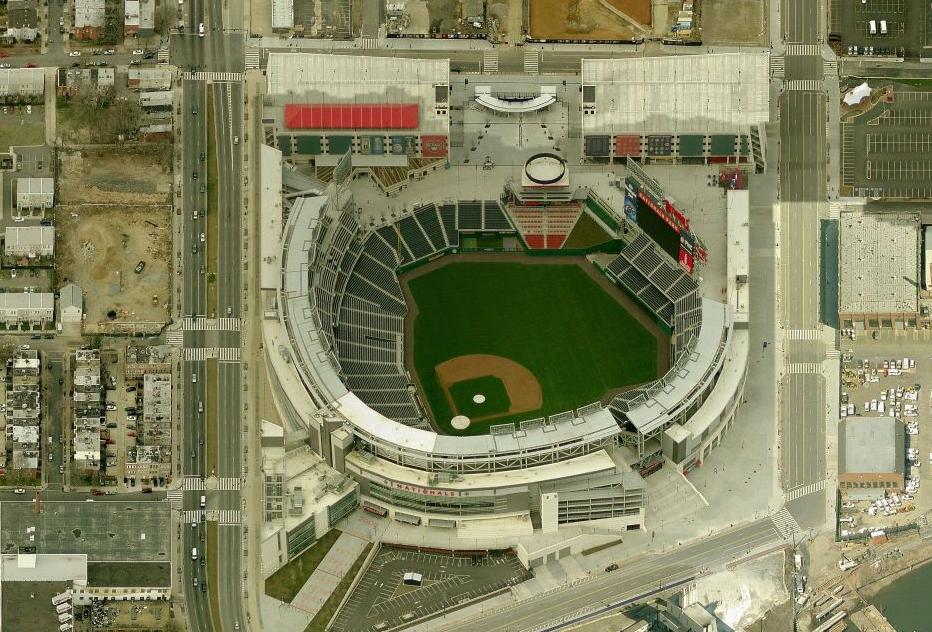
Nationals Park
First pitch 6:45p
· roof open
Park 0.99×
Wind 5 mph cross
88°F
open
+4
5 mph · slight_out
73°F
6:45p
Neutral for HR environment
+4
5 mph · slight_out
73°F
7:45p
Neutral for HR environment
+4
5 mph · slight_out
73°F
8:45p
Neutral for HR environment
+4
5 mph · slight_out
73°F
9:45p
Neutral for HR environment
+4
5 mph · slight_out
73°F
10:45p
Neutral for HR environment
⚪ Boost · Combined 1.19
88°F, wind 5 mph SSW (cross) — modifier: +2. Park, wind, temperature, and roof are inputs to Combined, not separate signals to stack on top.

9 batters
| # | Batter | Score | Tier | Odds | Form | Rank | ISO ?Isolated Power — career SLG minus AVG. >.220 elite, .180–.220 above avg, <.140 below avg. | EV ?Avg Exit Velocity (mph) — Statcast season-to-date. >92 elite, 89–92 above avg, <86 below avg. | Barrel% ?Barrel rate vs. this pitch mix — percentage of contact classified as barrels (perfect EV + LA combo). >12% elite, 8–12% above avg. | HR/FB ?Batter HR / Fly Ball rate for this matchup. A vs LHP/vs RHP chip means a handedness split is shown; otherwise the value is overall. | HR Dist ?Average distance (ft) of this batter's HRs. >400ft elite raw power, 380–400 above avg. | Sea HR% ?Season HR rate (HRs / PAs so far this year). v3.5 model feature — top backtest contributor. | 14d Pace ?Recent 14-day HR pace (HRs / games started). v3.5 model feature — captures current form. | Match% ?HR/FB Matchup — combined batter × pitcher HR/FB rate. The headline "how favorable is this matchup" number. | BBE ?Sample size — batted-ball events. <30 = small sample, treat stats with caution. | |
|---|---|---|---|---|---|---|---|---|---|---|---|---|---|---|---|---|
| 1 |

|
Kyle Schwarber | 82 | 🟢 A | +305 | · | 2 | 0.341 | 93.3 | 14.9% | 40.9% vs LHP | 404 | 28.6% | 33.3% | 32.6% | 29 |
| 2 |

|
Bryce Harper ⚡ | 68 | 🔵 C+ | +500 | 🌤️ WARM | 18 | 0.244 | 90.4 | 11.5% | 12.5% vs LHP | 401 | 20.8% | 25.0% | 24.0% | 32 |
| 3 |

|
Brandon Marsh | 47 | ⚪ D | +950 | ❄ COLD | 102 | 0.167 | 89.8 | 8.7% | 8.3% vs LHP | 393 | 10.1% | 8.3% | 9.1% | 29 |
| 4 |

|
Edmundo Sosa | 46 | ⚪ D | +750 | ❄ COLD | 107 | 0.155 | 86.4 | 8.2% | 37.5% vs LHP | 398 | 11.1% | 14.3% | 14.4% | 19 |
| 5 |

|
Bryson Stott | 44 | ⚪ D | +1000 | ❄ COLD | 122 | 0.156 | 89.3 | 8.4% | 14.3% vs LHP | 392 | 9.0% | 0.0% | 9.3% | 38 |
| 6 |

|
Alec Bohm | 43 | ⚪ D | +750 | 🌤️ WARM | 134 | 0.139 | 89.6 | 6.7% | 17.4% vs LHP | 385 | 11.4% | 18.2% | 10.2% | 39 |
| 7 |

|
Derek Hill | 42 | ⚪ D | +950 | ❄ COLD | 138 | 0.136 | 89.8 | 9.2% | 36.4% vs LHP | 406 | 6.2% | 0.0% | 11.8% | 12 |
| 8 |

|
Trea Turner ⚡ | 36 | ⚪ D | +800 | ❄ COLD | 174 | 0.107 | 88.7 | 7.0% | 4.3% vs LHP | 394 | 9.9% | 0.0% | 7.6% | 31 |
| 9 |

|
Rafael Marchan | 29 | ⚪ D | +950 | ❄ COLD | 196 | 0.079 | 84.7 | 5.9% | 20.0% vs LHP | 377 | 0.0% | 0.0% | 12.0% | 3 |

8 batters
| # | Batter | Score | Tier | Odds | Form | Rank | ISO ?Isolated Power — career SLG minus AVG. >.220 elite, .180–.220 above avg, <.140 below avg. | EV ?Avg Exit Velocity (mph) — Statcast season-to-date. >92 elite, 89–92 above avg, <86 below avg. | Barrel% ?Barrel rate vs. this pitch mix — percentage of contact classified as barrels (perfect EV + LA combo). >12% elite, 8–12% above avg. | HR/FB ?Batter HR / Fly Ball rate for this matchup. A vs LHP/vs RHP chip means a handedness split is shown; otherwise the value is overall. | HR Dist ?Average distance (ft) of this batter's HRs. >400ft elite raw power, 380–400 above avg. | Sea HR% ?Season HR rate (HRs / PAs so far this year). v3.5 model feature — top backtest contributor. | 14d Pace ?Recent 14-day HR pace (HRs / games started). v3.5 model feature — captures current form. | Match% ?HR/FB Matchup — combined batter × pitcher HR/FB rate. The headline "how favorable is this matchup" number. | BBE ?Sample size — batted-ball events. <30 = small sample, treat stats with caution. | |
|---|---|---|---|---|---|---|---|---|---|---|---|---|---|---|---|---|
| 1 |

|
James Wood | 67 | 🔵 C+ | +390 | · | 23 | 0.253 | 95.8 | 11.3% | 31.2% vs LHP | 408 | 27.1% | 25.0% | 31.0% | 36 |
| 2 |

|
Curtis Mead | 56 | 🟠 C | +625 | 🌧️ COOL | 61 | 0.231 | 88.7 | 7.4% | 21.7% vs LHP | 400 | 18.4% | 22.2% | 23.3% | 29 |
| 3 |

|
Dylan Crews | 51 | 🟠 C | +475 | · | 81 | 0.168 | 91.1 | 7.5% | 14.3% vs LHP | 415 | 25.0% | 33.3% | 18.6% | 34 |
| 4 |

|
Cj Abrams ⚡ | 47 | ⚪ D | +390 | · | 97 | 0.229 | 90.3 | 7.4% | 12.5% vs LHP | 389 | 0.0% | 0.0% | 23.3% | 35 |
| 5 |

|
Keibert Ruiz | 46 | ⚪ D | +700 | 🌧️ COOL | 108 | 0.194 | 88.9 | 5.5% | 20.0% vs LHP | 378 | 16.7% | 14.3% | 13.7% | 28 |
| 6 |

|
Daylen Lile | 37 | ⚪ D | +700 | 🌧️ COOL | 167 | 0.159 | 87.7 | 6.1% | 0.0% vs LHP | 403 | 8.6% | 0.0% | 7.6% | 39 |
| 7 |

|
Jacob Young | 36 | ⚪ D | · | 🌤️ WARM | 173 | 0.150 | 89.2 | 5.8% | 6.2% vs LHP | 391 | 9.8% | 0.0% | 8.7% | 22 |
| 8 |

|
Nasim Nunez | 13 | ⚪ D | · | · | 212 | 0.045 | 84.7 | · | 0.0% vs LHP | 0 | 0.0% | 0.0% | 6.7% | 26 |