 PHI
PHI
@
7:07p
 TOR
TOR
Stadium Conditions
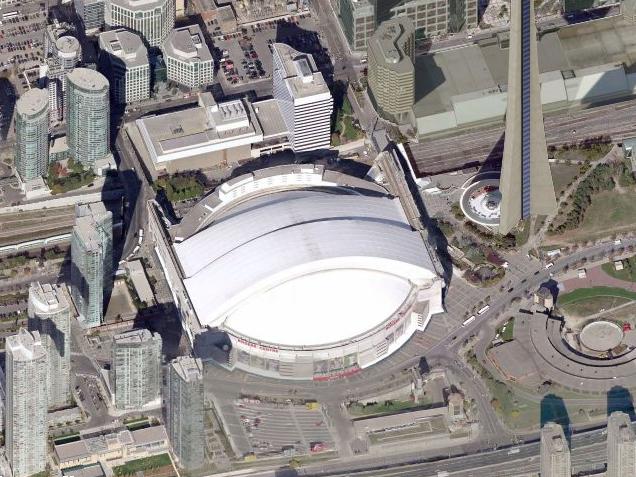
Rogers Centre
First pitch 7:07p
· roof unknown
Park 1.07×
Wind 0 mph dome
—
unknown
Hourly forecast unavailable; showing current stadium conditions only.
⚪ Elevated · Combined 1.07
Dome — weather irrelevant. Park, wind, temperature, and roof are inputs to Combined, not separate signals to stack on top.

8 batters
| # | Batter | Score | Tier | Odds | Form | Rank | ISO ?Isolated Power — career SLG minus AVG. >.220 elite, .180–.220 above avg, <.140 below avg. | EV ?Avg Exit Velocity (mph) — Statcast season-to-date. >92 elite, 89–92 above avg, <86 below avg. | Barrel% ?Barrel rate vs. this pitch mix — percentage of contact classified as barrels (perfect EV + LA combo). >12% elite, 8–12% above avg. | HR/FB ?Batter HR / Fly Ball rate for this matchup. A vs LHP/vs RHP chip means a handedness split is shown; otherwise the value is overall. | HR Dist ?Average distance (ft) of this batter's HRs. >400ft elite raw power, 380–400 above avg. | Sea HR% ?Season HR rate (HRs / PAs so far this year). v3.5 model feature — top backtest contributor. | 14d Pace ?Recent 14-day HR pace (HRs / games started). v3.5 model feature — captures current form. | Match% ?HR/FB Matchup — combined batter × pitcher HR/FB rate. The headline "how favorable is this matchup" number. | BBE ?Sample size — batted-ball events. <30 = small sample, treat stats with caution. | |
|---|---|---|---|---|---|---|---|---|---|---|---|---|---|---|---|---|
| 1 |

|
Kyle Schwarber | 89 | 🟢 A | +750 | 🌧️ COOL | 1 | 0.336 | 93.1 | 17.2% | 44.4% vs RHP | 402 | 26.7% | 16.7% | 43.3% | 25 |
| 2 |

|
Bryce Harper ⚡ | 73 | 🟡 B | +700 | 🌤️ WARM | 10 | 0.235 | 90.0 | 13.8% | 36.7% vs RHP | 408 | 19.4% | 8.3% | 24.1% | 26 |
| 3 |

|
Brandon Marsh | 62 | 🔵 C+ | · | 🔥 HOT | 27 | 0.175 | 90.5 | 10.4% | 21.2% vs RHP | 391 | 10.2% | 27.3% | 26.0% | 25 |
| 4 |

|
Bryson Stott | 55 | 🟠 C | · | · | 58 | 0.155 | 90.0 | 10.2% | 11.9% vs RHP | 392 | 10.5% | 9.1% | 12.1% | 33 |
| 5 |

|
Adolis Garcia | 51 | 🟠 C | · | 🌤️ WARM | 72 | 0.134 | 92.1 | 11.5% | 12.5% vs RHP | 399 | 0.0% | 0.0% | 16.9% | 23 |
| 6 |

|
Alec Bohm | 48 | ⚪ D | · | 🌤️ WARM | 84 | 0.131 | 90.2 | 7.1% | 13.0% vs RHP | 376 | 9.8% | 16.7% | 10.8% | 37 |
| 7 |

|
Trea Turner ⚡ | 47 | ⚪ D | · | 🌧️ COOL | 96 | 0.113 | 88.9 | 8.6% | 14.6% vs RHP | 394 | 11.3% | 8.3% | 10.1% | 39 |
| 8 |

|
Justin Crawford | 37 | ⚪ D | · | 🌧️ COOL | 156 | 0.110 | 87.6 | 4.4% | 8.3% vs RHP | 382 | 4.3% | 0.0% | 9.7% | 23 |

6 batters
| # | Batter | Score | Tier | Odds | Form | Rank | ISO ?Isolated Power — career SLG minus AVG. >.220 elite, .180–.220 above avg, <.140 below avg. | EV ?Avg Exit Velocity (mph) — Statcast season-to-date. >92 elite, 89–92 above avg, <86 below avg. | Barrel% ?Barrel rate vs. this pitch mix — percentage of contact classified as barrels (perfect EV + LA combo). >12% elite, 8–12% above avg. | HR/FB ?Batter HR / Fly Ball rate for this matchup. A vs LHP/vs RHP chip means a handedness split is shown; otherwise the value is overall. | HR Dist ?Average distance (ft) of this batter's HRs. >400ft elite raw power, 380–400 above avg. | Sea HR% ?Season HR rate (HRs / PAs so far this year). v3.5 model feature — top backtest contributor. | 14d Pace ?Recent 14-day HR pace (HRs / games started). v3.5 model feature — captures current form. | Match% ?HR/FB Matchup — combined batter × pitcher HR/FB rate. The headline "how favorable is this matchup" number. | BBE ?Sample size — batted-ball events. <30 = small sample, treat stats with caution. | |
|---|---|---|---|---|---|---|---|---|---|---|---|---|---|---|---|---|
| 1 |

|
Brandon Valenzuela | 62 | 🔵 C+ | · | 🌤️ WARM | 28 | 0.217 | 89.5 | 8.0% | 33.3% vs LHP | 397 | 17.6% | 33.3% | 30.8% | 27 |
| 2 |

|
Kazuma Okamoto | 58 | 🟠 C | +950 | 🌧️ COOL | 49 | 0.187 | 92.4 | 10.1% | 25.0% vs LHP | 405 | 14.6% | 23.1% | 24.4% | 28 |
| 3 |

|
Ernie Clement | 41 | ⚪ D | · | 🌤️ WARM | 128 | 0.160 | 85.6 | 4.5% | 15.8% vs LHP | 374 | 10.9% | 15.4% | 11.1% | 43 |
| 4 |

|
George Springer | 41 | ⚪ D | · | · | 130 | 0.153 | 87.9 | 7.3% | 7.7% vs LHP | 387 | 7.0% | 0.0% | 9.4% | 30 |
| 5 |

|
Myles Straw | 30 | ⚪ D | · | ❄ COLD | 193 | 0.094 | 86.4 | 5.7% | 5.9% vs LHP | 389 | 0.0% | 0.0% | 7.8% | 16 |
| 6 |

|
Nathan Lukes | 27 | ⚪ D | · | 🌤️ WARM | 203 | 0.086 | 86.6 | 2.7% | 4.2% | 374 | 2.1% | 9.1% | 9.0% | 41 |