 MIN
MIN
@
9:45p
 AZ
AZ
Stadium Conditions
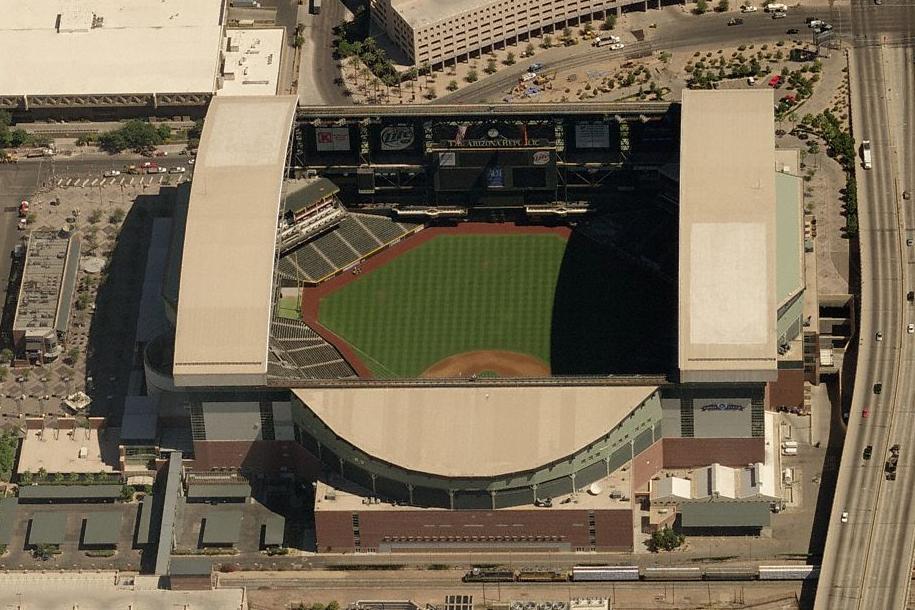
Chase Field
First pitch 9:45p
· roof retractable
Park 0.94×
Wind 1 mph in
104°F
retractable
+3
8 mph · slight_out
110°F
9:45p
Neutral for HR environment
+3
8 mph · slight_out
110°F
10:45p
Neutral for HR environment
+3
8 mph · slight_out
110°F
11:45p
Neutral for HR environment
+3
8 mph · slight_out
110°F
12:45a
Neutral for HR environment
+3
8 mph · slight_out
110°F
1:45a
Neutral for HR environment
⚪ Boost · Combined 1.22
104°F, wind 1 mph SSE (in) — modifier: +3. Park, wind, temperature, and roof are inputs to Combined, not separate signals to stack on top.

9 batters
| # | Batter | Score | Tier | Odds | Form | Rank | ISO ?Isolated Power — career SLG minus AVG. >.220 elite, .180–.220 above avg, <.140 below avg. | EV ?Avg Exit Velocity (mph) — Statcast season-to-date. >92 elite, 89–92 above avg, <86 below avg. | Barrel% ?Barrel rate vs. this pitch mix — percentage of contact classified as barrels (perfect EV + LA combo). >12% elite, 8–12% above avg. | HR/FB ?Batter HR / Fly Ball rate for this matchup. A vs LHP/vs RHP chip means a handedness split is shown; otherwise the value is overall. | HR Dist ?Average distance (ft) of this batter's HRs. >400ft elite raw power, 380–400 above avg. | Sea HR% ?Season HR rate (HRs / PAs so far this year). v3.5 model feature — top backtest contributor. | 14d Pace ?Recent 14-day HR pace (HRs / games started). v3.5 model feature — captures current form. | Match% ?HR/FB Matchup — combined batter × pitcher HR/FB rate. The headline "how favorable is this matchup" number. | BBE ?Sample size — batted-ball events. <30 = small sample, treat stats with caution. | |
|---|---|---|---|---|---|---|---|---|---|---|---|---|---|---|---|---|
| 1 |

|
Byron Buxton | 73 | 🟡 B | +265 | 🌤️ WARM | 10 | 0.340 | 90.8 | 12.6% | 36.5% vs RHP | 402 | 33.9% | 50.0% | 27.4% | 27 |
| 2 |

|
Kody Clemens | 61 | 🔵 C+ | +400 | · | 39 | 0.250 | 92.6 | 10.6% | 20.9% vs RHP | 388 | 15.2% | 27.3% | 23.7% | 38 |
| 3 |

|
Royce Lewis | 49 | ⚪ D | +500 | · | 86 | 0.157 | 88.7 | 10.2% | 20.0% vs RHP | 392 | 17.6% | 27.3% | 14.9% | 32 |
| 4 |

|
Brooks Lee | 48 | ⚪ D | +750 | · | 94 | 0.181 | 87.8 | 6.6% | 20.0% vs RHP | 371 | 16.7% | 36.4% | 18.4% | 43 |
| 5 |

|
Josh Bell | 43 | ⚪ D | +525 | · | 120 | 0.141 | 89.5 | 9.3% | 20.0% vs RHP | 398 | 7.7% | 27.3% | 14.3% | 36 |
| 6 |

|
Trevor Larnach | 39 | ⚪ D | +700 | 🌤️ WARM | 137 | 0.138 | 86.5 | 7.7% | 12.1% vs RHP | 406 | 6.8% | 28.6% | 11.6% | 26 |
| 7 |

|
Victor Caratini | 30 | ⚪ D | +850 | 🌤️ WARM | 185 | 0.118 | · | 8.0% | 19.1% vs RHP | · | 0.0% | 0.0% | 8.3% | 19 |
| 8 |

|
Luke Keaschall | 25 | ⚪ D | +1000 | 🌤️ WARM | 200 | 0.091 | 84.9 | 5.0% | 5.4% vs RHP | 369 | 3.2% | 10.0% | 5.9% | 27 |
| 9 |

|
Austin Martin | 22 | ⚪ D | · | 🌤️ WARM | 205 | 0.082 | 86.8 | 4.6% | 4.3% vs RHP | 392 | 2.2% | 0.0% | 5.8% | 15 |

7 batters
| # | Batter | Score | Tier | Odds | Form | Rank | ISO ?Isolated Power — career SLG minus AVG. >.220 elite, .180–.220 above avg, <.140 below avg. | EV ?Avg Exit Velocity (mph) — Statcast season-to-date. >92 elite, 89–92 above avg, <86 below avg. | Barrel% ?Barrel rate vs. this pitch mix — percentage of contact classified as barrels (perfect EV + LA combo). >12% elite, 8–12% above avg. | HR/FB ?Batter HR / Fly Ball rate for this matchup. A vs LHP/vs RHP chip means a handedness split is shown; otherwise the value is overall. | HR Dist ?Average distance (ft) of this batter's HRs. >400ft elite raw power, 380–400 above avg. | Sea HR% ?Season HR rate (HRs / PAs so far this year). v3.5 model feature — top backtest contributor. | 14d Pace ?Recent 14-day HR pace (HRs / games started). v3.5 model feature — captures current form. | Match% ?HR/FB Matchup — combined batter × pitcher HR/FB rate. The headline "how favorable is this matchup" number. | BBE ?Sample size — batted-ball events. <30 = small sample, treat stats with caution. | |
|---|---|---|---|---|---|---|---|---|---|---|---|---|---|---|---|---|
| 1 |

|
Corbin Carroll | 65 | 🔵 C+ | +425 | · | 27 | 0.258 | 91.7 | 10.7% | 15.0% vs LHP | 406 | 18.9% | 33.3% | 21.2% | 35 |
| 2 |

|
Gabriel Moreno | 55 | 🟠 C | +700 | · | 56 | 0.215 | 89.8 | 9.4% | 20.0% vs LHP | 395 | 13.3% | 25.0% | 22.9% | 31 |
| 3 |

|
Ketel Marte | 46 | ⚪ D | +370 | 🌧️ COOL | 105 | 0.182 | 91.1 | 9.6% | 26.7% vs LHP | 416 | 10.9% | 0.0% | 12.3% | 44 |
| 4 |

|
Nolan Arenado ⚡ | 39 | ⚪ D | +625 | 🌧️ COOL | 141 | 0.163 | 85.3 | 7.4% | 21.4% vs LHP | 400 | 10.6% | 0.0% | 10.4% | 32 |
| 5 |

|
Ildemaro Vargas | 36 | ⚪ D | +850 | 🌧️ COOL | 159 | 0.161 | 86.7 | 5.9% | 33.3% vs LHP | 399 | 7.7% | 0.0% | 11.7% | 16 |
| 6 |

|
Adrian Del Castillo | 34 | ⚪ D | · | 🌤️ WARM | 171 | 0.124 | 88.9 | 7.3% | 11.1% | 396 | 8.8% | 0.0% | 8.0% | 6 |
| 7 |

|
Geraldo Perdomo | 30 | ⚪ D | +950 | 🌧️ COOL | 188 | 0.112 | 87.5 | 5.1% | 7.1% vs LHP | 379 | 5.2% | 8.3% | 6.9% | 34 |