 LAD
LAD
@
9:45p
 SF
SF
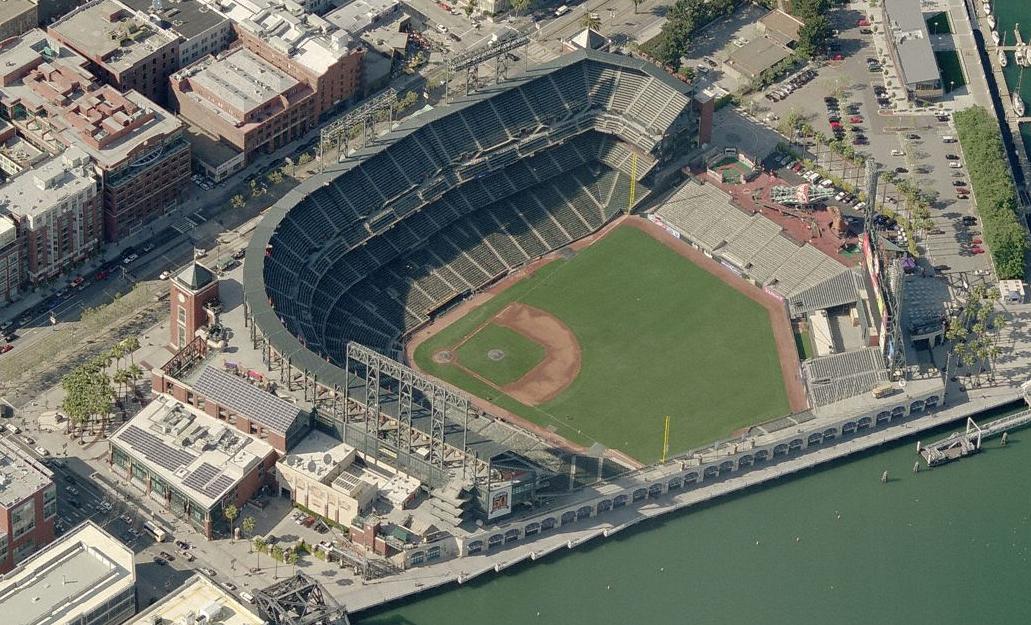
Park Factor
0.79×
Weather Mod
+2.0%
cold air · steady wind out · roof open
Combined
0.947
Temp
50.3°F
Wind
10.7 mph
out
Roof
open

9 batters
| # | Batter | Score | Tier | Odds | Form | Rank | ISO ?Isolated Power — career SLG minus AVG. >.220 elite, .180–.220 above avg, <.140 below avg. | EV ?Avg Exit Velocity (mph) — Statcast season-to-date. >92 elite, 89–92 above avg, <86 below avg. | Barrel% ?Barrel rate vs. this pitch mix — percentage of contact classified as barrels (perfect EV + LA combo). >12% elite, 8–12% above avg. | HR/FB ?Batter HR / Fly Ball rate — career, all pitchers. >18% elite, 14–18% above avg, <10% below avg. | HR Dist ?Average distance (ft) of this batter's HRs. >400ft elite raw power, 380–400 above avg. | Sea HR% ?Season HR rate (HRs / PAs so far this year). v3.5 model feature — top backtest contributor. | 14d Pace ?Recent 14-day HR pace (HRs / games started). v3.5 model feature — captures current form. | Match% ?HR/FB Matchup — combined batter × pitcher HR/FB rate. The headline "how favorable is this matchup" number. | BBE ?Sample size — batted-ball events. <30 = small sample, treat stats with caution. | |
|---|---|---|---|---|---|---|---|---|---|---|---|---|---|---|---|---|
| 1 |

|
Shohei Ohtani | 70 | 🟡 B | · | · | 30 | 0.223 | 94.0 | 23.9% | 20.8% | 403 | 10.0% | 9.1% | 22.2% | 30 |
| 2 |

|
Freddie Freeman | 61 | 🔵 C+ | · | · | 48 | 0.217 | 92.7 | 16.7% | 12.0% | 412 | 10.5% | 0.0% | 13.8% | 30 |
| 3 |

|
Teoscar Hernández | 60 | 🔵 C+ | · | 🌤️ WARM | 52 | 0.216 | 89.7 | 11.1% | 30.8% | 393 | 12.5% | 12.5% | 25.5% | 27 |
| 4 |

|
Andy Pages | 60 | 🔵 C+ | · | · | 53 | 0.232 | 91.9 | 8.9% | 33.3% | 392 | 20.0% | 18.2% | 28.5% | 27 |
| 5 |

|
Max Muncy | 58 | 🟠 C | · | 🌧️ COOL | 58 | 0.178 | 95.3 | 12.8% | 15.4% | 383 | 25.0% | 31.6% | 20.1% | 59 |
| 6 |

|
Miguel Rojas | 51 | 🟠 C | · | 🌤️ WARM | 79 | 0.143 | 90.0 | 4.3% | 25.0% | · | 50.0% | 50.0% | 13.3% | 15 |
| 7 |

|
Will Smith | 37 | ⚪ D | · | 🌧️ COOL | 146 | 0.097 | 88.8 | 12.2% | 9.1% | 416 | 10.0% | 0.0% | 7.9% | 30 |
| 8 |

|
Alex Freeland | 36 | ⚪ D | · | 🌤️ WARM | 155 | 0.086 | 92.1 | 6.9% | 14.3% | 413 | 0.0% | 0.0% | 8.6% | 19 |
| 9 |

|
Kyle Tucker | 36 | ⚪ D | · | 🌤️ WARM | 158 | 0.128 | 87.3 | 2.2% | 15.8% | 404 | 5.3% | 10.0% | 10.6% | 34 |
Shohei Ohtani
RHP
9 batters
| # | Batter | Score | Tier | Odds | Form | Rank | ISO ?Isolated Power — career SLG minus AVG. >.220 elite, .180–.220 above avg, <.140 below avg. | EV ?Avg Exit Velocity (mph) — Statcast season-to-date. >92 elite, 89–92 above avg, <86 below avg. | Barrel% ?Barrel rate vs. this pitch mix — percentage of contact classified as barrels (perfect EV + LA combo). >12% elite, 8–12% above avg. | HR/FB ?Batter HR / Fly Ball rate — career, all pitchers. >18% elite, 14–18% above avg, <10% below avg. | HR Dist ?Average distance (ft) of this batter's HRs. >400ft elite raw power, 380–400 above avg. | Sea HR% ?Season HR rate (HRs / PAs so far this year). v3.5 model feature — top backtest contributor. | 14d Pace ?Recent 14-day HR pace (HRs / games started). v3.5 model feature — captures current form. | Match% ?HR/FB Matchup — combined batter × pitcher HR/FB rate. The headline "how favorable is this matchup" number. | BBE ?Sample size — batted-ball events. <30 = small sample, treat stats with caution. | |
|---|---|---|---|---|---|---|---|---|---|---|---|---|---|---|---|---|
| 1 |

|
Willy Adames | 47 | ⚪ D | · | · | 92 | 0.205 | 88.4 | 12.0% | 15.8% | 375 | 11.1% | 11.1% | 11.0% | 32 |
| 2 |

|
Casey Schmitt | 43 | ⚪ D | · | · | 111 | 0.194 | 93.3 | 10.7% | 11.1% | 385 | 5.6% | 11.1% | 8.8% | 35 |
| 3 |

|
Heliot Ramos | 41 | ⚪ D | · | 🔥 HOT | 124 | 0.124 | 89.3 | 5.1% | 14.3% | · | 12.5% | 28.6% | 8.1% | 27 |
| 4 |

|
Rafael Devers | 27 | ⚪ D | · | · | 200 | 0.086 | 90.7 | 10.9% | 10.5% | 408 | 0.0% | 0.0% | 5.1% | 31 |
| 5 |

|
Harrison Bader | 25 | ⚪ D | · | ❄ COLD | 210 | 0.077 | 87.1 | 8.3% | 14.3% | 408 | 0.0% | 0.0% | 5.4% | 8 |
| 6 |

|
Jung Hoo Lee | 23 | ⚪ D | · | 🌤️ WARM | 218 | 0.111 | 88.9 | 2.0% | 7.7% | 361 | 5.6% | 11.1% | 4.9% | 38 |
| 7 |

|
Matt Chapman ⚡ | 19 | ⚪ D | · | · | 231 | 0.099 | 88.7 | 3.8% | 12.5% | 349 | 5.6% | 0.0% | 5.3% | 37 |
| 8 |

|
Patrick Bailey | 13 | ⚪ D | · | 🌤️ WARM | 252 | 0.000 | 89.1 | 5.3% | 0.0% | · | 0.0% | 0.0% | 6.1% | 18 |
| 9 |

|
Luis Arraez | 11 | ⚪ D | · | · | 255 | 0.058 | 85.4 | 0.0% | 0.0% | · | 0.0% | 0.0% | 3.8% | 39 |