 CWS
CWS
@
7:05p
 NYY
NYY
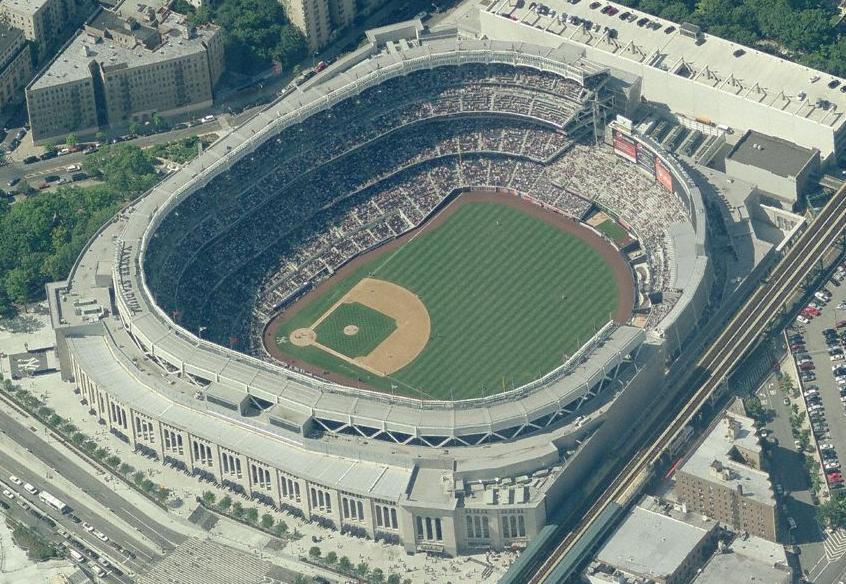
Stadium Conditions
Yankee Stadium
First pitch 7:05p
· roof open
Park 1.14×
Wind 12 mph out
74°F
open
+1
3 mph · in
68°F
7:05p
Neutral for HR environment
+1
3 mph · in
68°F
8:05p
Neutral for HR environment
+1
3 mph · in
68°F
9:05p
Neutral for HR environment
+1
3 mph · in
68°F
10:05p
Neutral for HR environment
+1
3 mph · in
68°F
11:05p
Neutral for HR environment
⚪ Boost · Combined 1.59
74°F, wind 12 mph S (out) — modifier: +4. Park, wind, temperature, and roof are inputs to Combined, not separate signals to stack on top.

7 batters
| # | Batter | Score | Tier | Odds | Form | Rank | ISO ?Isolated Power — career SLG minus AVG. >.220 elite, .180–.220 above avg, <.140 below avg. | EV ?Avg Exit Velocity (mph) — Statcast season-to-date. >92 elite, 89–92 above avg, <86 below avg. | Barrel% ?Barrel rate vs. this pitch mix — percentage of contact classified as barrels (perfect EV + LA combo). >12% elite, 8–12% above avg. | HR/FB ?Batter HR / Fly Ball rate for this matchup. A vs LHP/vs RHP chip means a handedness split is shown; otherwise the value is overall. | HR Dist ?Average distance (ft) of this batter's HRs. >400ft elite raw power, 380–400 above avg. | Sea HR% ?Season HR rate (HRs / PAs so far this year). v3.5 model feature — top backtest contributor. | 14d Pace ?Recent 14-day HR pace (HRs / games started). v3.5 model feature — captures current form. | Match% ?HR/FB Matchup — combined batter × pitcher HR/FB rate. The headline "how favorable is this matchup" number. | BBE ?Sample size — batted-ball events. <30 = small sample, treat stats with caution. | |
|---|---|---|---|---|---|---|---|---|---|---|---|---|---|---|---|---|
| 1 |

|
Ben Rice | 86 | 🟢 A | +750 | 🌧️ COOL | 1 | 0.319 | 92.0 | 12.6% | 55.6% vs LHP | 389 | 25.4% | 25.0% | 40.4% | 30 |
| 2 |

|
Paul Goldschmidt | 73 | 🟡 B | +700 | 🌧️ COOL | 13 | 0.230 | 87.5 | 10.7% | 38.5% vs LHP | 393 | 16.7% | 25.0% | 37.0% | 38 |
| 3 |

|
Jasson Dominguez ⚡ | 62 | 🔵 C+ | · | ❄ COLD | 33 | 0.292 | 91.4 | 5.0% | 27.3% | 353 | 0.0% | 0.0% | 27.8% | 6 |
| 4 |

|
Amed Rosario | 62 | 🔵 C+ | +900 | ❄ COLD | 37 | 0.211 | 90.3 | 10.7% | 17.6% vs LHP | 403 | 7.7% | 0.0% | 17.2% | 9 |
| 5 |

|
Cody Bellinger | 61 | 🔵 C+ | +1000 | · | 39 | 0.189 | 89.3 | 9.2% | 14.3% vs LHP | 381 | 12.5% | 16.7% | 12.7% | 40 |
| 6 |

|
Jose Caballero | 45 | ⚪ D | · | · | 117 | 0.138 | 83.4 | 5.9% | 30.0% vs LHP | 374 | 0.0% | 0.0% | 21.7% | 27 |
| 7 |

|
Anthony Volpe | 40 | ⚪ D | · | · | 148 | 0.099 | 85.1 | 6.3% | 14.3% vs LHP | 409 | 3.3% | 0.0% | 10.2% | 23 |

8 batters
| # | Batter | Score | Tier | Odds | Form | Rank | ISO ?Isolated Power — career SLG minus AVG. >.220 elite, .180–.220 above avg, <.140 below avg. | EV ?Avg Exit Velocity (mph) — Statcast season-to-date. >92 elite, 89–92 above avg, <86 below avg. | Barrel% ?Barrel rate vs. this pitch mix — percentage of contact classified as barrels (perfect EV + LA combo). >12% elite, 8–12% above avg. | HR/FB ?Batter HR / Fly Ball rate for this matchup. A vs LHP/vs RHP chip means a handedness split is shown; otherwise the value is overall. | HR Dist ?Average distance (ft) of this batter's HRs. >400ft elite raw power, 380–400 above avg. | Sea HR% ?Season HR rate (HRs / PAs so far this year). v3.5 model feature — top backtest contributor. | 14d Pace ?Recent 14-day HR pace (HRs / games started). v3.5 model feature — captures current form. | Match% ?HR/FB Matchup — combined batter × pitcher HR/FB rate. The headline "how favorable is this matchup" number. | BBE ?Sample size — batted-ball events. <30 = small sample, treat stats with caution. | |
|---|---|---|---|---|---|---|---|---|---|---|---|---|---|---|---|---|
| 1 |

|
Randal Grichuk | 72 | 🟡 B | +1000 | · | 14 | 0.278 | 90.2 | 8.4% | 27.8% vs LHP | 384 | 18.2% | 33.3% | 28.6% | 10 |
| 2 |

|
Colson Montgomery | 68 | 🔵 C+ | +950 | 🌤️ WARM | 20 | 0.249 | 90.0 | 8.5% | 33.3% vs LHP | 395 | 27.5% | 22.2% | 37.8% | 17 |
| 3 |

|
Miguel Vargas ⚡ | 62 | 🔵 C+ | · | ❄ COLD | 38 | 0.236 | 89.9 | 8.6% | 36.8% vs LHP | 391 | 21.8% | 9.1% | 17.8% | 32 |
| 4 |

|
Everson Pereira | 55 | 🟠 C | +1000 | 🌤️ WARM | 69 | 0.225 | 88.2 | 7.7% | 22.2% | 407 | 9.1% | 0.0% | 18.4% | 2 |
| 5 |

|
Chase Meidroth | 40 | ⚪ D | · | ❄ COLD | 151 | 0.129 | 87.7 | 5.2% | 16.7% vs LHP | 381 | 7.1% | 9.1% | 8.0% | 29 |
| 6 |

|
Sam Antonacci | 38 | ⚪ D | · | · | 160 | 0.106 | 88.0 | 6.3% | 5.6% | 415 | 3.2% | 10.0% | 8.5% | 25 |
| 7 |

|
Edgar Quero | 27 | ⚪ D | · | 🌧️ COOL | 211 | 0.050 | 90.6 | 3.3% | 11.1% vs LHP | 389 | 5.1% | 0.0% | 7.4% | 9 |
| 8 |

|
Luisangel Acuna | 23 | ⚪ D | · | 🌤️ WARM | 225 | 0.016 | 89.4 | 4.0% | 0.0% vs LHP | 0 | 0.0% | 0.0% | 6.0% | 11 |