 BOS
BOS
@
1:10p
 TB
TB
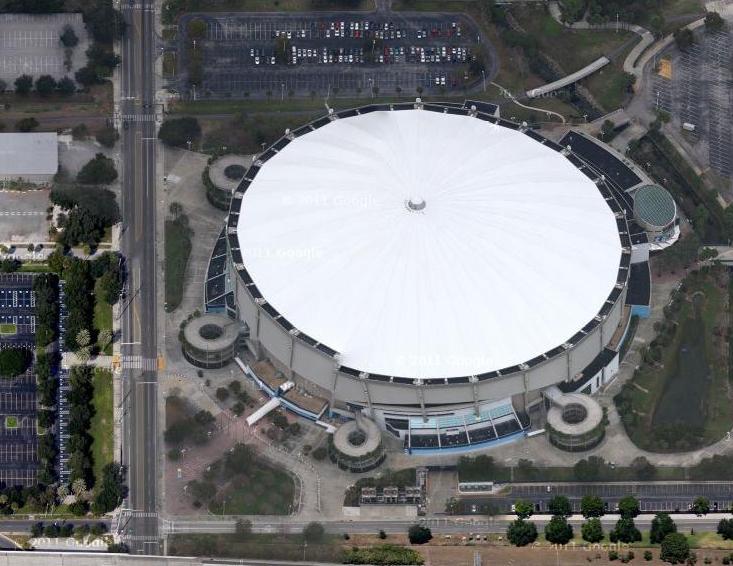
Stadium Conditions
Tropicana Field
First pitch 1:10p
· roof unknown
Park 1.09×
Wind 0 mph dome
—
unknown
Hourly forecast unavailable; showing current stadium conditions only.
⚪ Elevated · Combined 1.09
Dome — weather irrelevant. Park, wind, temperature, and roof are inputs to Combined, not separate signals to stack on top.

9 batters
| # | Batter | Score | Tier | Odds | Form | Rank | ISO ?Isolated Power — career SLG minus AVG. >.220 elite, .180–.220 above avg, <.140 below avg. | EV ?Avg Exit Velocity (mph) — Statcast season-to-date. >92 elite, 89–92 above avg, <86 below avg. | Barrel% ?Barrel rate vs. this pitch mix — percentage of contact classified as barrels (perfect EV + LA combo). >12% elite, 8–12% above avg. | HR/FB ?Batter HR / Fly Ball rate for this matchup. A vs LHP/vs RHP chip means a handedness split is shown; otherwise the value is overall. | HR Dist ?Average distance (ft) of this batter's HRs. >400ft elite raw power, 380–400 above avg. | Sea HR% ?Season HR rate (HRs / PAs so far this year). v3.5 model feature — top backtest contributor. | 14d Pace ?Recent 14-day HR pace (HRs / games started). v3.5 model feature — captures current form. | Match% ?HR/FB Matchup — combined batter × pitcher HR/FB rate. The headline "how favorable is this matchup" number. | BBE ?Sample size — batted-ball events. <30 = small sample, treat stats with caution. | |
|---|---|---|---|---|---|---|---|---|---|---|---|---|---|---|---|---|
| 1 |

|
Willson Contreras | 63 | 🔵 C+ | · | · | 26 | 0.225 | 90.0 | 10.4% | 32.0% vs RHP | 410 | 19.7% | 16.7% | 24.8% | 29 |
| 2 |

|
Jarren Duran | 55 | 🟠 C | · | · | 57 | 0.171 | 90.3 | 9.0% | 34.6% vs RHP | 391 | 14.5% | 23.1% | 28.2% | 34 |
| 3 |

|
Andruw Monasterio | 47 | ⚪ D | · | 🌤️ WARM | 93 | 0.144 | 87.7 | 6.9% | 0.0% vs RHP | 398 | 15.4% | 25.0% | 12.2% | 9 |
| 4 |

|
Wilyer Abreu ⚡ | 47 | ⚪ D | · | · | 94 | 0.147 | 89.8 | 9.1% | 12.1% vs RHP | 392 | 11.3% | 7.7% | 11.1% | 40 |
| 5 |

|
Ceddanne Rafaela | 42 | ⚪ D | · | 🌧️ COOL | 125 | 0.157 | 87.2 | 6.8% | 16.1% vs RHP | 364 | 8.3% | 0.0% | 10.4% | 40 |
| 6 |

|
Masataka Yoshida | 31 | ⚪ D | · | 🌤️ WARM | 185 | 0.105 | 88.9 | 3.6% | 3.7% vs RHP | 393 | 5.6% | 0.0% | 8.6% | 23 |
| 7 |

|
Mickey Gasper | 29 | ⚪ D | · | 🌧️ COOL | 196 | 0.065 | 91.8 | 6.2% | 0.0% vs RHP | 0 | 0.0% | 0.0% | 8.0% | 26 |
| 8 |

|
Caleb Durbin ⚡ | 27 | ⚪ D | · | 🌤️ WARM | 204 | 0.092 | 85.5 | 3.7% | 5.9% vs RHP | 386 | 1.7% | 0.0% | 7.4% | 36 |
| 9 |

|
Isiah Kiner-Falefa | 27 | ⚪ D | · | · | 206 | 0.057 | 83.7 | 5.2% | 0.0% vs RHP | 393 | 5.9% | 0.0% | 6.6% | 35 |

9 batters
| # | Batter | Score | Tier | Odds | Form | Rank | ISO ?Isolated Power — career SLG minus AVG. >.220 elite, .180–.220 above avg, <.140 below avg. | EV ?Avg Exit Velocity (mph) — Statcast season-to-date. >92 elite, 89–92 above avg, <86 below avg. | Barrel% ?Barrel rate vs. this pitch mix — percentage of contact classified as barrels (perfect EV + LA combo). >12% elite, 8–12% above avg. | HR/FB ?Batter HR / Fly Ball rate for this matchup. A vs LHP/vs RHP chip means a handedness split is shown; otherwise the value is overall. | HR Dist ?Average distance (ft) of this batter's HRs. >400ft elite raw power, 380–400 above avg. | Sea HR% ?Season HR rate (HRs / PAs so far this year). v3.5 model feature — top backtest contributor. | 14d Pace ?Recent 14-day HR pace (HRs / games started). v3.5 model feature — captures current form. | Match% ?HR/FB Matchup — combined batter × pitcher HR/FB rate. The headline "how favorable is this matchup" number. | BBE ?Sample size — batted-ball events. <30 = small sample, treat stats with caution. | |
|---|---|---|---|---|---|---|---|---|---|---|---|---|---|---|---|---|
| 1 |

|
Junior Caminero ⚡ | 61 | 🔵 C+ | · | · | 33 | 0.211 | 92.5 | 8.5% | 42.9% vs LHP | 408 | 21.3% | 8.3% | 20.1% | 36 |
| 2 |

|
Jonathan Aranda | 59 | 🟠 C | · | 🌤️ WARM | 40 | 0.192 | 90.8 | 8.5% | 9.1% vs LHP | 396 | 15.3% | 18.2% | 18.9% | 25 |
| 3 |

|
Yandy Diaz ⚡ | 52 | 🟠 C | · | · | 66 | 0.204 | 90.9 | 7.2% | 28.6% vs LHP | 385 | 0.0% | 0.0% | 28.9% | 39 |
| 4 |

|
Cedric Mullins | 40 | ⚪ D | · | 🌤️ WARM | 134 | 0.107 | 88.1 | 4.3% | 0.0% vs LHP | 386 | 8.2% | 18.2% | 10.8% | 25 |
| 5 |

|
Ryan Vilade | 39 | ⚪ D | · | · | 146 | 0.145 | 89.6 | 4.7% | 6.7% vs LHP | 414 | 0.0% | 0.0% | 9.1% | 24 |
| 6 |

|
Ben Williamson | 28 | ⚪ D | · | ❄ COLD | 200 | 0.077 | 88.7 | 2.3% | 12.5% vs LHP | 0 | 0.0% | 0.0% | 9.1% | 17 |
| 7 |

|
Taylor Walls | 28 | ⚪ D | · | ❄ COLD | 201 | 0.070 | 82.9 | 3.4% | 0.0% vs LHP | 0 | 0.0% | 0.0% | 7.2% | 11 |
| 8 |

|
Nick Fortes | 26 | ⚪ D | · | ❄ COLD | 211 | 0.064 | 86.4 | 2.2% | 0.0% vs LHP | 408 | 0.0% | 0.0% | 7.2% | 26 |
| 9 |

|
Austin Slater | 24 | ⚪ D | · | ❄ COLD | 217 | 0.022 | 85.0 | 4.1% | 0.0% vs LHP | 0 | 0.0% | 0.0% | 9.0% | 6 |