 SD
SD
@
7:45p
 STL
STL
Stadium Conditions
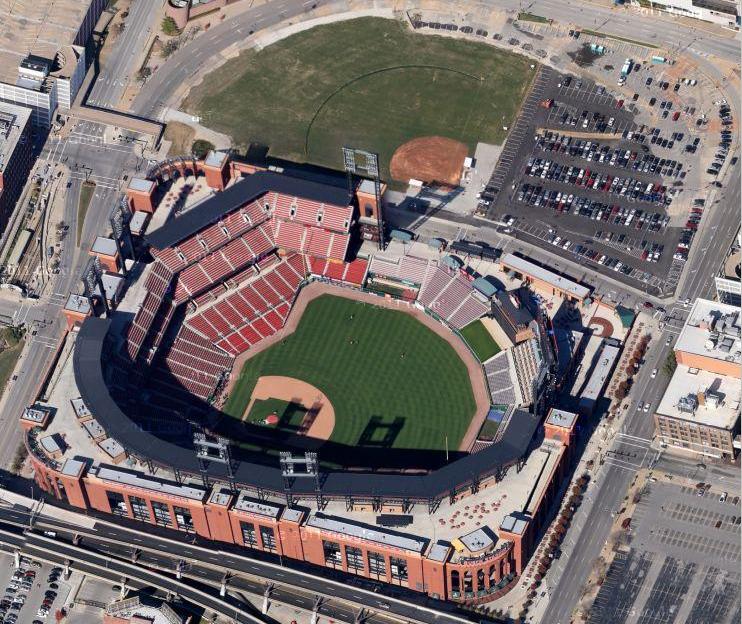
Busch Stadium
First pitch 7:45p
· roof open
Park 0.84×
Wind 14 mph in
80°F
open
+2
6 mph · out
81°F
7:45p
Neutral for HR environment
+2
6 mph · out
81°F
8:45p
Neutral for HR environment
+2
6 mph · out
81°F
9:45p
Neutral for HR environment
+2
6 mph · out
81°F
10:45p
Neutral for HR environment
+2
6 mph · out
81°F
11:45p
Neutral for HR environment
⚪ Suppress · Combined 0.68
80°F, wind 14 mph WNW (in) — modifier: -2. Park, wind, temperature, and roof are inputs to Combined, not separate signals to stack on top.
7 batters
| # | Batter | Score | Tier | Odds | Form | Rank | ISO ?Isolated Power — career SLG minus AVG. >.220 elite, .180–.220 above avg, <.140 below avg. | EV ?Avg Exit Velocity (mph) — Statcast season-to-date. >92 elite, 89–92 above avg, <86 below avg. | Barrel% ?Barrel rate vs. this pitch mix — percentage of contact classified as barrels (perfect EV + LA combo). >12% elite, 8–12% above avg. | HR/FB ?Batter HR / Fly Ball rate for this matchup. A vs LHP/vs RHP chip means a handedness split is shown; otherwise the value is overall. | HR Dist ?Average distance (ft) of this batter's HRs. >400ft elite raw power, 380–400 above avg. | Sea HR% ?Season HR rate (HRs / PAs so far this year). v3.5 model feature — top backtest contributor. | 14d Pace ?Recent 14-day HR pace (HRs / games started). v3.5 model feature — captures current form. | Match% ?HR/FB Matchup — combined batter × pitcher HR/FB rate. The headline "how favorable is this matchup" number. | BBE ?Sample size — batted-ball events. <30 = small sample, treat stats with caution. | |
|---|---|---|---|---|---|---|---|---|---|---|---|---|---|---|---|---|
| 1 |

|
Jordan Walker ⚡ | 66 | 🔵 C+ | +950 | · | 26 | 0.269 | 94.7 | 12.0% | 32.5% vs RHP | 408 | 20.7% | 25.0% | 25.1% | 41 |
| 2 |

|
Lars Nootbaar ⚡ | 59 | 🟠 C | +950 | · | 47 | 0.286 | 95.1 | 12.8% | 16.7% vs RHP | 439 | 0.0% | 0.0% | 21.8% | 25 |
| 3 |

|
Alec Burleson | 58 | 🟠 C | +850 | 🌤️ WARM | 51 | 0.199 | 91.6 | 11.0% | 25.0% vs RHP | 405 | 19.1% | 50.0% | 20.4% | 43 |
| 4 |

|
Ivan Herrera | 38 | ⚪ D | · | · | 161 | 0.175 | 89.7 | 8.5% | 18.5% vs RHP | 405 | 0.0% | 0.0% | 11.1% | 38 |
| 5 |

|
Nathan Church | 36 | ⚪ D | · | ❄ COLD | 174 | 0.140 | 85.8 | 9.3% | 25.0% vs RHP | 387 | 7.3% | 0.0% | 8.5% | 14 |
| 6 |

|
Jj Wetherholt | 34 | ⚪ D | · | 🌧️ COOL | 178 | 0.135 | 90.5 | 8.9% | 17.0% vs RHP | 392 | 0.0% | 0.0% | 7.5% | 30 |
| 7 |

|
Masyn Winn | 23 | ⚪ D | · | 🌧️ COOL | 217 | 0.082 | 87.1 | 5.8% | 10.5% vs RHP | 379 | 3.1% | 0.0% | 7.0% | 34 |

6 batters
| # | Batter | Score | Tier | Odds | Form | Rank | ISO ?Isolated Power — career SLG minus AVG. >.220 elite, .180–.220 above avg, <.140 below avg. | EV ?Avg Exit Velocity (mph) — Statcast season-to-date. >92 elite, 89–92 above avg, <86 below avg. | Barrel% ?Barrel rate vs. this pitch mix — percentage of contact classified as barrels (perfect EV + LA combo). >12% elite, 8–12% above avg. | HR/FB ?Batter HR / Fly Ball rate for this matchup. A vs LHP/vs RHP chip means a handedness split is shown; otherwise the value is overall. | HR Dist ?Average distance (ft) of this batter's HRs. >400ft elite raw power, 380–400 above avg. | Sea HR% ?Season HR rate (HRs / PAs so far this year). v3.5 model feature — top backtest contributor. | 14d Pace ?Recent 14-day HR pace (HRs / games started). v3.5 model feature — captures current form. | Match% ?HR/FB Matchup — combined batter × pitcher HR/FB rate. The headline "how favorable is this matchup" number. | BBE ?Sample size — batted-ball events. <30 = small sample, treat stats with caution. | |
|---|---|---|---|---|---|---|---|---|---|---|---|---|---|---|---|---|
| 1 |

|
Rodolfo Duran | 56 | 🟠 C | · | 🌧️ COOL | 64 | 0.286 | 89.1 | 11.1% | 42.9% vs RHP | 402 | 0.0% | 0.0% | 30.0% | 13 |
| 2 |

|
Gavin Sheets | 51 | 🟠 C | +950 | · | 84 | 0.237 | 89.2 | 7.5% | 32.4% vs RHP | 394 | 12.9% | 16.7% | 20.2% | 32 |
| 3 |

|
Manny Machado | 45 | ⚪ D | +1000 | · | 119 | 0.182 | 89.7 | 7.8% | 25.7% vs RHP | 396 | 16.9% | 15.4% | 11.3% | 43 |
| 4 |

|
Ty France | 44 | ⚪ D | · | 🌧️ COOL | 129 | 0.191 | 91.3 | 8.6% | 29.4% vs RHP | 395 | 12.5% | 0.0% | 12.3% | 18 |
| 5 |

|
Jackson Merrill | 39 | ⚪ D | · | · | 155 | 0.140 | 90.0 | 8.0% | 11.6% vs RHP | 405 | 10.9% | 15.4% | 7.4% | 42 |
| 6 |

|
Xander Bogaerts ⚡ | 32 | ⚪ D | · | 🌤️ WARM | 187 | 0.123 | 87.9 | 6.8% | 20.6% vs RHP | 395 | 11.1% | 0.0% | 7.7% | 22 |