 NYM
NYM
@
7:15p
 PHI
PHI
Stadium Conditions
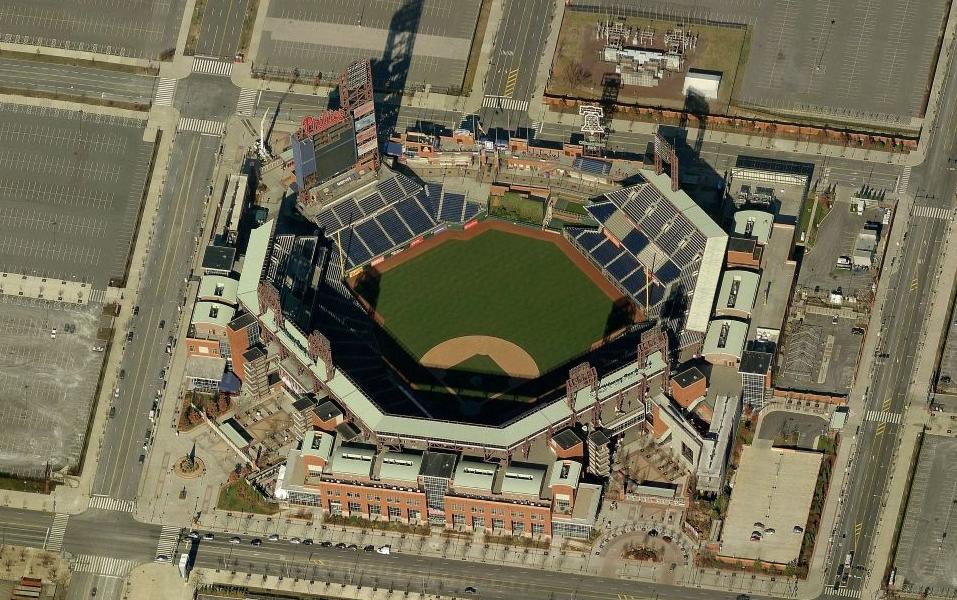
Citizens Bank Park
First pitch 7:15p
· roof open
Park 1.09×
Wind 4 mph cross
82°F
open
+0
5 mph · cross
69°F
7:15p
Neutral for HR environment
+0
5 mph · cross
69°F
8:15p
Neutral for HR environment
+0
5 mph · cross
69°F
9:15p
Neutral for HR environment
+0
5 mph · cross
69°F
10:15p
Neutral for HR environment
+0
5 mph · cross
69°F
11:15p
Neutral for HR environment
⚪ Boost · Combined 1.20
82°F, wind 4 mph NW (cross) — modifier: +1. Park, wind, temperature, and roof are inputs to Combined, not separate signals to stack on top.

7 batters
| # | Batter | Score | Tier | Odds | Form | Rank | ISO ?Isolated Power — career SLG minus AVG. >.220 elite, .180–.220 above avg, <.140 below avg. | EV ?Avg Exit Velocity (mph) — Statcast season-to-date. >92 elite, 89–92 above avg, <86 below avg. | Barrel% ?Barrel rate vs. this pitch mix — percentage of contact classified as barrels (perfect EV + LA combo). >12% elite, 8–12% above avg. | HR/FB ?Batter HR / Fly Ball rate for this matchup. A vs LHP/vs RHP chip means a handedness split is shown; otherwise the value is overall. | HR Dist ?Average distance (ft) of this batter's HRs. >400ft elite raw power, 380–400 above avg. | Sea HR% ?Season HR rate (HRs / PAs so far this year). v3.5 model feature — top backtest contributor. | 14d Pace ?Recent 14-day HR pace (HRs / games started). v3.5 model feature — captures current form. | Match% ?HR/FB Matchup — combined batter × pitcher HR/FB rate. The headline "how favorable is this matchup" number. | BBE ?Sample size — batted-ball events. <30 = small sample, treat stats with caution. | |
|---|---|---|---|---|---|---|---|---|---|---|---|---|---|---|---|---|
| 1 |

|
Kyle Schwarber | 76 | 🟡 B | +400 | 🌧️ COOL | 7 | 0.316 | 93.1 | 10.5% | 44.7% vs RHP | 401 | 26.5% | 16.7% | 40.1% | 25 |
| 2 |

|
Bryce Harper ⚡ | 60 | 🔵 C+ | +950 | 🌧️ COOL | 44 | 0.226 | 90.1 | 8.3% | 36.4% vs RHP | 403 | 18.6% | 8.3% | 21.4% | 30 |
| 3 |

|
Brandon Marsh | 52 | 🟠 C | · | 🌤️ WARM | 71 | 0.169 | 90.1 | 6.4% | 21.6% vs RHP | 393 | 10.4% | 25.0% | 23.3% | 30 |
| 4 |

|
Alec Bohm | 46 | ⚪ D | · | 🌤️ WARM | 103 | 0.142 | 89.8 | 4.9% | 17.9% vs RHP | 385 | 11.8% | 27.3% | 14.1% | 36 |
| 5 |

|
Bryson Stott | 43 | ⚪ D | · | 🌧️ COOL | 130 | 0.155 | 89.4 | 6.2% | 10.4% vs RHP | 392 | 9.2% | 0.0% | 10.9% | 33 |
| 6 |

|
Trea Turner ⚡ | 37 | ⚪ D | +950 | ❄ COLD | 162 | 0.109 | 88.6 | 5.1% | 13.6% vs RHP | 394 | 10.1% | 0.0% | 7.3% | 29 |
| 7 |

|
Justin Crawford | 29 | ⚪ D | · | ❄ COLD | 198 | 0.096 | 86.7 | 2.5% | 7.4% vs RHP | 382 | 3.9% | 0.0% | 8.8% | 23 |

7 batters
| # | Batter | Score | Tier | Odds | Form | Rank | ISO ?Isolated Power — career SLG minus AVG. >.220 elite, .180–.220 above avg, <.140 below avg. | EV ?Avg Exit Velocity (mph) — Statcast season-to-date. >92 elite, 89–92 above avg, <86 below avg. | Barrel% ?Barrel rate vs. this pitch mix — percentage of contact classified as barrels (perfect EV + LA combo). >12% elite, 8–12% above avg. | HR/FB ?Batter HR / Fly Ball rate for this matchup. A vs LHP/vs RHP chip means a handedness split is shown; otherwise the value is overall. | HR Dist ?Average distance (ft) of this batter's HRs. >400ft elite raw power, 380–400 above avg. | Sea HR% ?Season HR rate (HRs / PAs so far this year). v3.5 model feature — top backtest contributor. | 14d Pace ?Recent 14-day HR pace (HRs / games started). v3.5 model feature — captures current form. | Match% ?HR/FB Matchup — combined batter × pitcher HR/FB rate. The headline "how favorable is this matchup" number. | BBE ?Sample size — batted-ball events. <30 = small sample, treat stats with caution. | |
|---|---|---|---|---|---|---|---|---|---|---|---|---|---|---|---|---|
| 1 |

|
Juan Soto | 72 | 🟡 B | · | 🌧️ COOL | 14 | 0.274 | 93.2 | 11.8% | 16.0% vs LHP | 399 | 22.0% | 25.0% | 25.7% | 38 |
| 2 |

|
Mark Vientos | 48 | ⚪ D | · | 🌧️ COOL | 97 | 0.168 | 89.4 | 9.7% | 15.8% vs LHP | 413 | 10.7% | 0.0% | 16.0% | 14 |
| 3 |

|
Marcus Semien | 47 | ⚪ D | · | · | 100 | 0.136 | 86.2 | 8.9% | 6.7% vs LHP | 391 | 11.1% | 25.0% | 13.1% | 31 |
| 4 |

|
Bo Bichette ⚡ | 43 | ⚪ D | · | 🌧️ COOL | 129 | 0.122 | 90.5 | 8.2% | 25.0% vs LHP | 381 | 8.3% | 16.7% | 13.6% | 43 |
| 5 |

|
Carson Benge | 42 | ⚪ D | · | 🌧️ COOL | 138 | 0.125 | 90.0 | 9.2% | 25.0% vs LHP | 401 | 6.8% | 8.3% | 9.1% | 40 |
| 6 |

|
Luis Torrens | 32 | ⚪ D | · | 🌧️ COOL | 186 | 0.095 | 88.4 | 6.2% | 0.0% vs LHP | 413 | 4.8% | 0.0% | 6.6% | 17 |
| 7 |

|
Zack Short | 29 | ⚪ D | · | ❄ COLD | 195 | 0.050 | 90.7 | 8.1% | 0.0% vs LHP | 0 | 0.0% | 0.0% | 8.2% | 5 |