 MIN
MIN
@
—
 BAL
BAL
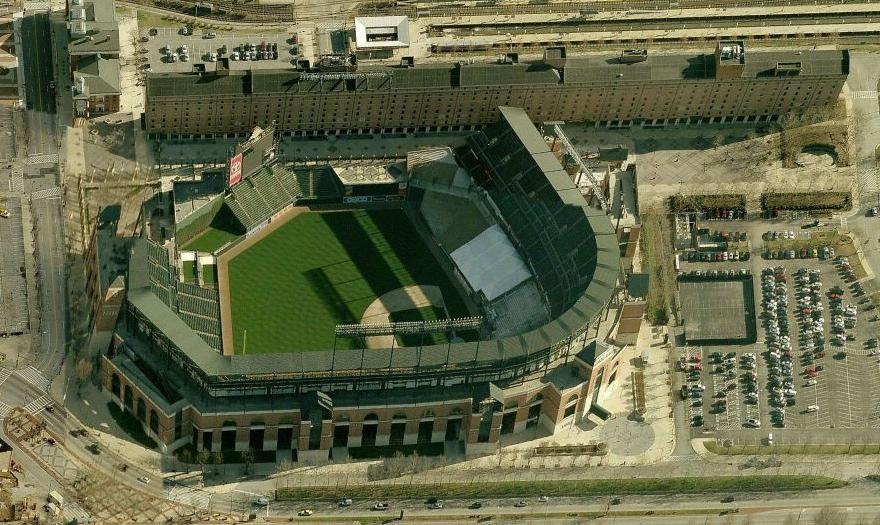
Park Factor
1.28×
Weather Mod
+0.0%
cold air · strong partial wind out · roof open
Combined
1.280
Temp
43.6°F
Wind
17.3 mph
slight_out
Roof
open

Kyle Bradish
RHP
9 batters
| # | Batter | Score | Tier | Odds | Form | Rank | ISO ?Isolated Power — career SLG minus AVG. >.220 elite, .180–.220 above avg, <.140 below avg. | EV ?Avg Exit Velocity (mph) — Statcast season-to-date. >92 elite, 89–92 above avg, <86 below avg. | Barrel% ?Barrel rate vs. this pitch mix — percentage of contact classified as barrels (perfect EV + LA combo). >12% elite, 8–12% above avg. | HR/FB ?Batter HR / Fly Ball rate — career, all pitchers. >18% elite, 14–18% above avg, <10% below avg. | HR Dist ?Average distance (ft) of this batter's HRs. >400ft elite raw power, 380–400 above avg. | Sea HR% ?Season HR rate (HRs / PAs so far this year). v3.5 model feature — top backtest contributor. | 14d Pace ?Recent 14-day HR pace (HRs / games started). v3.5 model feature — captures current form. | Match% ?HR/FB Matchup — combined batter × pitcher HR/FB rate. The headline "how favorable is this matchup" number. | BBE ?Sample size — batted-ball events. <30 = small sample, treat stats with caution. | |
|---|---|---|---|---|---|---|---|---|---|---|---|---|---|---|---|---|
| 1 |

|
Byron Buxton | 65 | 🔵 C+ | · | · | 8 | 0.287 | 92.5 | 12.4% | 21.3% | 406 | 0.0% | 0.0% | 18.7% | 0 |
| 2 |

|
Matt Wallner | 54 | 🟠 C | · | ❄ COLD | 36 | 0.262 | 91.0 | 11.0% | 19.6% | 406 | 0.0% | 0.0% | 17.9% | 15 |
| 3 |

|
Kody Clemens | 54 | 🟠 C | · | 🌤️ WARM | 38 | 0.221 | 91.5 | 10.3% | 15.7% | 392 | 0.0% | 0.0% | 16.0% | 1 |
| 4 |

|
Josh Bell ⚡ | 49 | ⚪ D | · | ❄ COLD | 70 | 0.179 | 90.4 | 10.3% | 15.1% | 404 | 0.0% | 0.0% | 15.7% | 2 |
| 5 |

|
Ryan Jeffers | 46 | ⚪ D | · | 🌤️ WARM | 96 | 0.131 | 89.3 | 7.4% | 7.0% | 411 | 0.0% | 0.0% | 10.7% | 27 |
| 6 |

|
Royce Lewis | 44 | ⚪ D | · | 🌤️ WARM | 115 | 0.152 | 89.8 | 8.8% | 9.6% | 402 | 0.0% | 0.0% | 12.5% | 1 |
| 7 |

|
Trevor Larnach | 43 | ⚪ D | · | ❄ COLD | 124 | 0.153 | 90.9 | 8.0% | 12.0% | 405 | 0.0% | 0.0% | 14.0% | 1 |
| 8 |

|
Brooks Lee | 39 | ⚪ D | · | 🔥 HOT | 161 | 0.133 | 88.6 | 7.1% | 10.3% | 383 | 0.0% | 0.0% | 13.0% | 5 |
| 9 |

|
Luke Keaschall | 39 | ⚪ D | · | 🔥 HOT | 165 | 0.143 | 86.2 | 6.8% | 7.7% | 399 | 0.0% | 0.0% | 11.2% | 6 |

Taj Bradley
RHP
9 batters
| # | Batter | Score | Tier | Odds | Form | Rank | ISO ?Isolated Power — career SLG minus AVG. >.220 elite, .180–.220 above avg, <.140 below avg. | EV ?Avg Exit Velocity (mph) — Statcast season-to-date. >92 elite, 89–92 above avg, <86 below avg. | Barrel% ?Barrel rate vs. this pitch mix — percentage of contact classified as barrels (perfect EV + LA combo). >12% elite, 8–12% above avg. | HR/FB ?Batter HR / Fly Ball rate — career, all pitchers. >18% elite, 14–18% above avg, <10% below avg. | HR Dist ?Average distance (ft) of this batter's HRs. >400ft elite raw power, 380–400 above avg. | Sea HR% ?Season HR rate (HRs / PAs so far this year). v3.5 model feature — top backtest contributor. | 14d Pace ?Recent 14-day HR pace (HRs / games started). v3.5 model feature — captures current form. | Match% ?HR/FB Matchup — combined batter × pitcher HR/FB rate. The headline "how favorable is this matchup" number. | BBE ?Sample size — batted-ball events. <30 = small sample, treat stats with caution. | |
|---|---|---|---|---|---|---|---|---|---|---|---|---|---|---|---|---|
| 1 |

|
Colton Cowser | 55 | 🟠 C | · | 🌤️ WARM | 28 | 0.190 | 90.9 | 10.1% | 20.5% | 405 | 0.0% | 0.0% | 19.8% | 4 |
| 2 |

|
Tyler O'Neill | 55 | 🟠 C | · | 🌧️ COOL | 30 | 0.193 | 88.8 | 10.9% | 13.0% | 406 | 0.0% | 0.0% | 15.8% | 3 |
| 3 |

|
Jordan Westburg | 53 | 🟠 C | · | · | 44 | 0.192 | 90.2 | 9.0% | 16.0% | 397 | 0.0% | 0.0% | 17.5% | 10 |
| 4 |

|
Coby Mayo | 49 | ⚪ D | · | 🌧️ COOL | 71 | 0.171 | 87.3 | 8.5% | 12.1% | 405 | 0.0% | 0.0% | 15.2% | 1 |
| 5 |

|
Gunnar Henderson | 48 | ⚪ D | · | 🌤️ WARM | 80 | 0.165 | 92.1 | 7.8% | 12.3% | 393 | 0.0% | 0.0% | 15.4% | 4 |
| 6 |

|
Jackson Holliday | 47 | ⚪ D | · | 🌤️ WARM | 87 | 0.133 | 88.8 | 7.5% | 11.2% | 393 | 0.0% | 0.0% | 14.6% | 3 |
| 7 |

|
Ryan Mountcastle | 45 | ⚪ D | · | · | 103 | 0.117 | 90.7 | 9.2% | 8.9% | 404 | 0.0% | 0.0% | 13.1% | 0 |
| 8 |

|
Adley Rutschman | 45 | ⚪ D | · | 🌧️ COOL | 105 | 0.146 | 89.4 | 7.3% | 8.5% | 395 | 0.0% | 0.0% | 12.8% | 3 |
| 9 |

|
Dylan Carlson | 43 | ⚪ D | · | 🌤️ WARM | 126 | 0.134 | 88.4 | 7.0% | 8.6% | 376 | 0.0% | 0.0% | 12.8% | 3 |