 LAD
LAD
@
6:40p
 MIN
MIN
Stadium Conditions
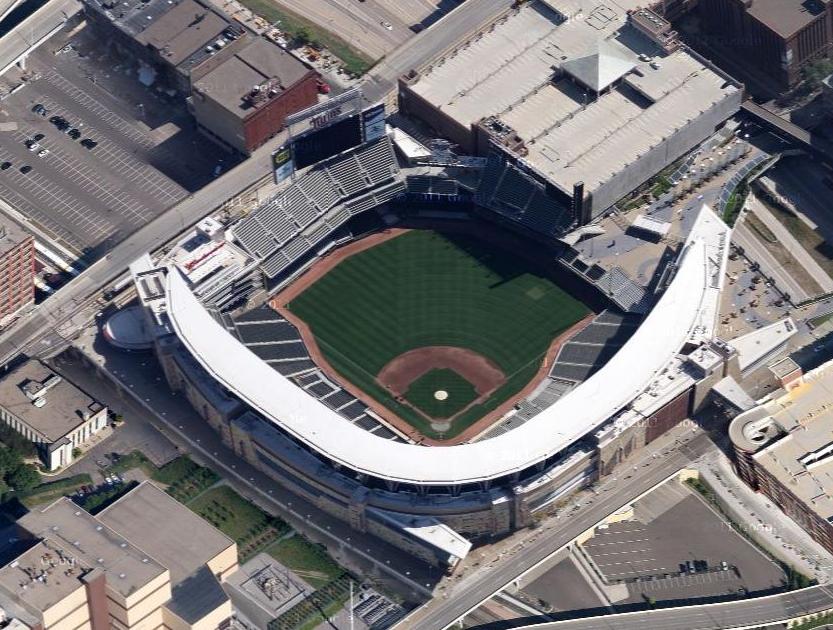
Target Field
First pitch 6:40p
· roof open
Park 1.01×
Wind 4 mph out
70°F
open
-2
5 mph · cross
64°F
6:40p
Neutral for HR environment
-4
6 mph · cross
64°F
7:40p
Neutral for HR environment
-5
6 mph · in
64°F
8:40p
Suppress for HR environment
-7
7 mph · in
65°F
9:40p
Suppress for HR environment
-7
7 mph · in
64°F
10:40p
Suppress for HR environment
⚪ Elevated · Combined 1.01
70°F, wind 4 mph W (out) — modifier: +0. Park, wind, temperature, and roof are inputs to Combined, not separate signals to stack on top.

8 batters
| # | Batter | Score | Tier | Odds | Form | Rank | ISO ?Isolated Power — career SLG minus AVG. >.220 elite, .180–.220 above avg, <.140 below avg. | EV ?Avg Exit Velocity (mph) — Statcast season-to-date. >92 elite, 89–92 above avg, <86 below avg. | Barrel% ?Barrel rate vs. this pitch mix — percentage of contact classified as barrels (perfect EV + LA combo). >12% elite, 8–12% above avg. | HR/FB ?Batter HR / Fly Ball rate for this matchup. A vs LHP/vs RHP chip means a handedness split is shown; otherwise the value is overall. | HR Dist ?Average distance (ft) of this batter's HRs. >400ft elite raw power, 380–400 above avg. | Sea HR% ?Season HR rate (HRs / PAs so far this year). v3.5 model feature — top backtest contributor. | 14d Pace ?Recent 14-day HR pace (HRs / games started). v3.5 model feature — captures current form. | Match% ?HR/FB Matchup — combined batter × pitcher HR/FB rate. The headline "how favorable is this matchup" number. | BBE ?Sample size — batted-ball events. <30 = small sample, treat stats with caution. | |
|---|---|---|---|---|---|---|---|---|---|---|---|---|---|---|---|---|
| 1 |

|
Byron Buxton | 75 | 🟡 B | +235 | 🌤️ WARM | 7 | 0.328 | 90.9 | 12.0% | 30.0% vs LHP | 402 | 34.8% | 53.8% | 24.9% | 40 |
| 2 |

|
Royce Lewis | 54 | 🟠 C | +425 | 🌤️ WARM | 62 | 0.165 | 88.7 | 10.2% | 16.7% vs LHP | 397 | 18.4% | 30.8% | 14.5% | 40 |
| 3 |

|
Ryan Kreidler | 49 | ⚪ D | +750 | 🌤️ WARM | 89 | 0.229 | 88.3 | 9.0% | 20.0% vs LHP | 409 | 5.9% | 0.0% | 12.4% | 21 |
| 4 |

|
Brooks Lee | 48 | ⚪ D | +750 | 🌧️ COOL | 94 | 0.190 | 87.5 | 5.9% | 16.7% vs LHP | 371 | 15.7% | 25.0% | 12.8% | 47 |
| 5 |

|
Josh Bell | 46 | ⚪ D | +525 | · | 105 | 0.148 | 89.7 | 8.6% | 9.5% vs LHP | 402 | 9.1% | 27.3% | 10.5% | 40 |
| 6 |

|
Victor Caratini | 36 | ⚪ D | +850 | · | 162 | 0.134 | 89.0 | 7.2% | 10.0% vs LHP | 407 | 5.9% | 0.0% | 10.2% | 25 |
| 7 |

|
Luke Keaschall | 27 | ⚪ D | +950 | 🔥 HOT | 205 | 0.086 | 84.5 | 4.9% | 5.0% vs LHP | 369 | 3.0% | 8.3% | 5.7% | 34 |
| 8 |

|
Austin Martin | 24 | ⚪ D | +1000 | 🌧️ COOL | 212 | 0.081 | 86.7 | 4.3% | 5.3% vs LHP | 392 | 2.2% | 0.0% | 5.7% | 13 |

7 batters
| # | Batter | Score | Tier | Odds | Form | Rank | ISO ?Isolated Power — career SLG minus AVG. >.220 elite, .180–.220 above avg, <.140 below avg. | EV ?Avg Exit Velocity (mph) — Statcast season-to-date. >92 elite, 89–92 above avg, <86 below avg. | Barrel% ?Barrel rate vs. this pitch mix — percentage of contact classified as barrels (perfect EV + LA combo). >12% elite, 8–12% above avg. | HR/FB ?Batter HR / Fly Ball rate for this matchup. A vs LHP/vs RHP chip means a handedness split is shown; otherwise the value is overall. | HR Dist ?Average distance (ft) of this batter's HRs. >400ft elite raw power, 380–400 above avg. | Sea HR% ?Season HR rate (HRs / PAs so far this year). v3.5 model feature — top backtest contributor. | 14d Pace ?Recent 14-day HR pace (HRs / games started). v3.5 model feature — captures current form. | Match% ?HR/FB Matchup — combined batter × pitcher HR/FB rate. The headline "how favorable is this matchup" number. | BBE ?Sample size — batted-ball events. <30 = small sample, treat stats with caution. | |
|---|---|---|---|---|---|---|---|---|---|---|---|---|---|---|---|---|
| 1 |

|
Shohei Ohtani | 70 | 🟡 B | +255 | 🔥 HOT | 13 | 0.252 | 93.8 | 12.0% | 25.0% vs LHP | 404 | 19.2% | 54.5% | 21.9% | 25 |
| 2 |

|
Max Muncy | 66 | 🔵 C+ | +400 | 🌧️ COOL | 24 | 0.246 | 90.5 | 11.5% | 27.8% vs LHP | 408 | 19.3% | 26.7% | 22.5% | 48 |
| 3 |

|
Freddie Freeman | 54 | 🟠 C | +500 | 🌤️ WARM | 63 | 0.191 | 90.7 | 10.0% | 15.8% vs LHP | 396 | 14.9% | 23.1% | 14.5% | 38 |
| 4 |

|
Andy Pages | 51 | 🟠 C | +425 | ❄ COLD | 77 | 0.211 | 89.5 | 8.5% | 13.6% vs LHP | 390 | 16.0% | 7.7% | 9.7% | 43 |
| 5 |

|
Mookie Betts | 45 | ⚪ D | +500 | · | 111 | 0.170 | 89.8 | 8.2% | 9.1% vs LHP | 385 | 8.3% | 15.4% | 7.3% | 44 |
| 6 |

|
Alex Freeland ⚡ | 33 | ⚪ D | +850 | 🌧️ COOL | 178 | 0.110 | 89.5 | 7.3% | 16.7% vs LHP | 373 | 3.7% | 0.0% | 6.3% | 20 |
| 7 |

|
Alex Call | 20 | ⚪ D | +950 | 🌤️ WARM | 218 | 0.060 | 83.4 | 3.3% | 0.0% vs LHP | 0 | 0.0% | 0.0% | 4.7% | 14 |