 BAL
BAL
@
1:10p
 TB
TB
Park Factor
0.95×
Weather Mod
+0.0%
neutral
Combined
0.947
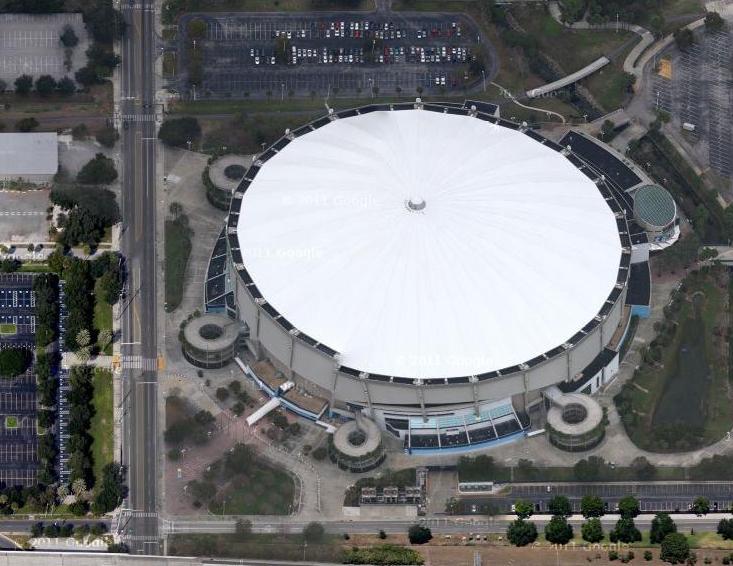
Wind
0 mph
dome

Steven Matz
RHP
9 batters
| # | Batter | Score | Tier | Odds | Form | Rank | ISO ?Isolated Power — career SLG minus AVG. >.220 elite, .180–.220 above avg, <.140 below avg. | EV ?Avg Exit Velocity (mph) — Statcast season-to-date. >92 elite, 89–92 above avg, <86 below avg. | Barrel% ?Barrel rate vs. this pitch mix — percentage of contact classified as barrels (perfect EV + LA combo). >12% elite, 8–12% above avg. | HR/FB ?Batter HR / Fly Ball rate — career, all pitchers. >18% elite, 14–18% above avg, <10% below avg. | HR Dist ?Average distance (ft) of this batter's HRs. >400ft elite raw power, 380–400 above avg. | Sea HR% ?Season HR rate (HRs / PAs so far this year). v3.5 model feature — top backtest contributor. | 14d Pace ?Recent 14-day HR pace (HRs / games started). v3.5 model feature — captures current form. | Match% ?HR/FB Matchup — combined batter × pitcher HR/FB rate. The headline "how favorable is this matchup" number. | BBE ?Sample size — batted-ball events. <30 = small sample, treat stats with caution. | |
|---|---|---|---|---|---|---|---|---|---|---|---|---|---|---|---|---|
| 1 |

|
Adley Rutschman | 72 | 🟡 B | · | 🌤️ WARM | 21 | 0.262 | 89.0 | 10.0% | 20.0% | 399 | 21.1% | 40.0% | 26.5% | 34 |
| 2 |

|
Pete Alonso | 60 | 🔵 C+ | · | · | 39 | 0.206 | 94.6 | 11.9% | 20.7% | 394 | 14.6% | 15.4% | 15.6% | 39 |
| 3 |

|
Samuel Basallo | 54 | 🟠 C | · | · | 63 | 0.202 | 92.5 | 10.4% | 25.0% | 405 | 12.5% | 8.3% | 13.7% | 27 |
| 4 |

|
Gunnar Henderson | 54 | 🟠 C | · | · | 64 | 0.196 | 90.1 | 9.9% | 17.1% | 389 | 19.6% | 7.7% | 12.1% | 42 |
| 5 |

|
Jeremiah Jackson | 48 | ⚪ D | · | 🌤️ WARM | 91 | 0.162 | 89.1 | 8.5% | 23.1% | 396 | 11.8% | 0.0% | 12.0% | 31 |
| 6 |

|
Tyler O'Neill | 35 | ⚪ D | · | · | 172 | 0.065 | 89.5 | 5.4% | 15.4% | 397 | 13.3% | 33.3% | 8.5% | 23 |
| 7 |

|
Taylor Ward | 29 | ⚪ D | · | 🌧️ COOL | 205 | 0.112 | 89.0 | 4.7% | 0.0% | 390 | 4.1% | 7.7% | 5.5% | 25 |
| 8 |

|
Weston Wilson | 20 | ⚪ D | · | ❄ COLD | 239 | 0.072 | 87.5 | 4.8% | 0.0% | 363 | 0.0% | 0.0% | 11.5% | 10 |
| 9 |

|
Blaze Alexander | 18 | ⚪ D | · | ❄ COLD | 243 | 0.045 | 91.8 | 1.5% | 0.0% | · | 0.0% | 0.0% | 7.0% | 9 |

Shane Baz
RHP
9 batters
| # | Batter | Score | Tier | Odds | Form | Rank | ISO ?Isolated Power — career SLG minus AVG. >.220 elite, .180–.220 above avg, <.140 below avg. | EV ?Avg Exit Velocity (mph) — Statcast season-to-date. >92 elite, 89–92 above avg, <86 below avg. | Barrel% ?Barrel rate vs. this pitch mix — percentage of contact classified as barrels (perfect EV + LA combo). >12% elite, 8–12% above avg. | HR/FB ?Batter HR / Fly Ball rate — career, all pitchers. >18% elite, 14–18% above avg, <10% below avg. | HR Dist ?Average distance (ft) of this batter's HRs. >400ft elite raw power, 380–400 above avg. | Sea HR% ?Season HR rate (HRs / PAs so far this year). v3.5 model feature — top backtest contributor. | 14d Pace ?Recent 14-day HR pace (HRs / games started). v3.5 model feature — captures current form. | Match% ?HR/FB Matchup — combined batter × pitcher HR/FB rate. The headline "how favorable is this matchup" number. | BBE ?Sample size — batted-ball events. <30 = small sample, treat stats with caution. | |
|---|---|---|---|---|---|---|---|---|---|---|---|---|---|---|---|---|
| 1 |

|
Junior Caminero | 71 | 🟡 B | · | 🌤️ WARM | 23 | 0.223 | 92.0 | 13.0% | 32.1% | 407 | 27.3% | 30.8% | 34.4% | 40 |
| 2 |

|
Jonathan Aranda | 51 | 🟠 C | · | · | 75 | 0.196 | 89.5 | 10.4% | 21.1% | 396 | 14.0% | 7.7% | 11.1% | 31 |
| 3 |

|
Ryan Vilade | 40 | ⚪ D | · | 🌤️ WARM | 128 | 0.158 | 90.0 | 4.0% | 16.7% | 402 | 0.0% | 0.0% | 14.4% | 16 |
| 4 |

|
Jonny DeLuca | 25 | ⚪ D | · | ❄ COLD | 218 | 0.161 | 85.1 | 3.4% | 0.0% | 416 | 0.0% | 0.0% | 8.6% | 28 |
| 5 |

|
Richie Palacios | 23 | ⚪ D | · | · | 231 | 0.064 | 86.0 | 5.2% | 9.1% | 382 | 0.0% | 0.0% | 6.1% | 19 |
| 6 |

|
Chandler Simpson | 17 | ⚪ D | · | · | 249 | 0.044 | 83.9 | · | 9.1% | · | 0.0% | 0.0% | 5.9% | 38 |
| 7 |

|
Cedric Mullins | 17 | ⚪ D | · | ❄ COLD | 250 | 0.078 | 87.1 | 1.7% | 11.5% | 379 | 6.1% | 8.3% | 6.1% | 30 |
| 8 |

|
Taylor Walls | 14 | ⚪ D | · | 🌧️ COOL | 254 | 0.054 | 82.6 | 2.4% | 0.0% | · | 0.0% | 0.0% | 4.7% | 30 |
| 9 |

|
Hunter Feduccia | 12 | ⚪ D | · | 🌧️ COOL | 257 | 0.023 | 88.0 | · | 0.0% | · | 0.0% | 0.0% | 5.6% | 12 |