 ATH
ATH
@
6:38p
 LAA
LAA
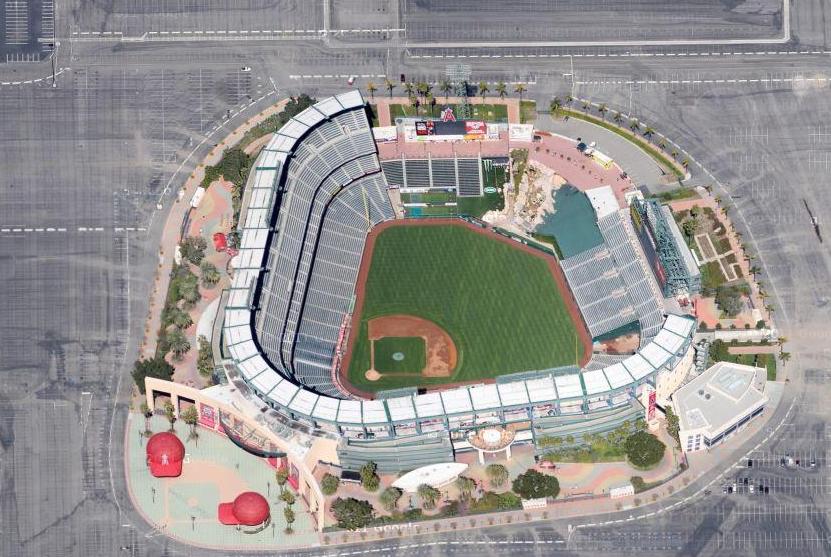
Stadium Conditions
Angel Stadium
First pitch 6:38p
· roof open
Park 0.99×
Wind 3 mph out
65°F
open
-11
11 mph · in
72°F
6:38p
Suppress for HR environment
-10
10 mph · in
69°F
7:38p
Suppress for HR environment
-9
9 mph · in
67°F
8:38p
Suppress for HR environment
-8
8 mph · in
65°F
9:38p
Suppress for HR environment
-8
8 mph · in
64°F
10:38p
Suppress for HR environment
⚪ Neutral · Combined 0.99
65°F, wind 3 mph N (out) — modifier: +0 — mild park boost, weather flat.
7 batters
| # | Batter | Score | Tier | Odds | Form | Rank | ISO ?Isolated Power — career SLG minus AVG. >.220 elite, .180–.220 above avg, <.140 below avg. | EV ?Avg Exit Velocity (mph) — Statcast season-to-date. >92 elite, 89–92 above avg, <86 below avg. | Barrel% ?Barrel rate vs. this pitch mix — percentage of contact classified as barrels (perfect EV + LA combo). >12% elite, 8–12% above avg. | HR/FB ?Batter HR / Fly Ball rate for this matchup. A vs LHP/vs RHP chip means a handedness split is shown; otherwise the value is overall. | HR Dist ?Average distance (ft) of this batter's HRs. >400ft elite raw power, 380–400 above avg. | Sea HR% ?Season HR rate (HRs / PAs so far this year). v3.5 model feature — top backtest contributor. | 14d Pace ?Recent 14-day HR pace (HRs / games started). v3.5 model feature — captures current form. | Match% ?HR/FB Matchup — combined batter × pitcher HR/FB rate. The headline "how favorable is this matchup" number. | BBE ?Sample size — batted-ball events. <30 = small sample, treat stats with caution. | |
|---|---|---|---|---|---|---|---|---|---|---|---|---|---|---|---|---|
| 1 |

|
Nick Kurtz | 67 | 🔵 C+ | +320 | · | 16 | 0.251 | 94.3 | 10.3% | 43.3% vs RHP | 410 | 22.4% | 23.1% | 30.6% | 29 |
| 2 |

|
Shea Langeliers | 62 | 🔵 C+ | +350 | · | 31 | 0.251 | 91.4 | 9.2% | 21.4% vs RHP | 416 | 20.8% | 18.2% | 17.5% | 37 |
| 3 |

|
Tyler Soderstrom | 55 | 🟠 C | +475 | 🌧️ COOL | 59 | 0.233 | 89.9 | 7.8% | 17.4% vs RHP | 403 | 14.7% | 15.4% | 14.6% | 37 |
| 4 |

|
Carlos Cortes | 39 | ⚪ D | · | ❄ COLD | 135 | 0.155 | 89.7 | 6.9% | 16.2% vs RHP | 404 | 5.4% | 0.0% | 8.8% | 17 |
| 5 |

|
Lawrence Butler ⚡ | 35 | ⚪ D | +575 | 🌤️ WARM | 160 | 0.119 | 88.3 | 6.2% | 26.1% vs RHP | 402 | 4.6% | 8.3% | 8.3% | 23 |
| 6 |

|
Jacob Wilson | 28 | ⚪ D | · | 🌤️ WARM | 198 | 0.105 | 84.2 | 3.1% | 11.5% vs RHP | 375 | 5.2% | 10.0% | 7.5% | 36 |
| 7 |

|
Jeff Mcneil | 25 | ⚪ D | +850 | 🌧️ COOL | 211 | 0.082 | 85.9 | 2.4% | 10.0% vs RHP | 373 | 6.2% | 10.0% | 6.8% | 26 |
8 batters
| # | Batter | Score | Tier | Odds | Form | Rank | ISO ?Isolated Power — career SLG minus AVG. >.220 elite, .180–.220 above avg, <.140 below avg. | EV ?Avg Exit Velocity (mph) — Statcast season-to-date. >92 elite, 89–92 above avg, <86 below avg. | Barrel% ?Barrel rate vs. this pitch mix — percentage of contact classified as barrels (perfect EV + LA combo). >12% elite, 8–12% above avg. | HR/FB ?Batter HR / Fly Ball rate for this matchup. A vs LHP/vs RHP chip means a handedness split is shown; otherwise the value is overall. | HR Dist ?Average distance (ft) of this batter's HRs. >400ft elite raw power, 380–400 above avg. | Sea HR% ?Season HR rate (HRs / PAs so far this year). v3.5 model feature — top backtest contributor. | 14d Pace ?Recent 14-day HR pace (HRs / games started). v3.5 model feature — captures current form. | Match% ?HR/FB Matchup — combined batter × pitcher HR/FB rate. The headline "how favorable is this matchup" number. | BBE ?Sample size — batted-ball events. <30 = small sample, treat stats with caution. | |
|---|---|---|---|---|---|---|---|---|---|---|---|---|---|---|---|---|
| 1 |

|
Zach Neto | 62 | 🔵 C+ | +350 | 🔥 HOT | 30 | 0.225 | 90.2 | 8.9% | 23.2% vs RHP | 403 | 20.0% | 33.3% | 25.1% | 28 |
| 2 |

|
Jorge Soler | 60 | 🔵 C+ | +400 | 🔥 HOT | 38 | 0.221 | 88.1 | 8.3% | 39.3% vs RHP | 402 | 16.7% | 66.7% | 21.3% | 5 |
| 3 |

|
Oswald Peraza | 40 | ⚪ D | +700 | · | 130 | 0.152 | 87.3 | 7.2% | 11.1% vs RHP | 386 | 8.8% | 0.0% | 8.6% | 18 |
| 4 |

|
Vaughn Grissom | 39 | ⚪ D | · | ❄ COLD | 134 | 0.144 | 89.6 | 6.3% | 16.7% vs RHP | 396 | 10.0% | 0.0% | 8.8% | 16 |
| 5 |

|
Jo Adell | 39 | ⚪ D | +425 | ❄ COLD | 138 | 0.134 | 90.3 | 7.0% | 10.0% vs RHP | 415 | 10.7% | 0.0% | 7.4% | 41 |
| 6 |

|
Logan O'Hoppe | 38 | ⚪ D | +500 | 🌧️ COOL | 144 | 0.119 | 87.2 | 8.1% | 14.3% vs RHP | 408 | 4.6% | 10.0% | 7.8% | 25 |
| 7 |

|
Josh Lowe | 37 | ⚪ D | +850 | 🌤️ WARM | 146 | 0.120 | 88.6 | 6.9% | 16.1% vs RHP | 384 | 9.3% | 0.0% | 10.5% | 2 |
| 8 |

|
Nolan Schanuel | 36 | ⚪ D | +950 | 🌧️ COOL | 154 | 0.128 | 87.5 | 3.9% | 15.4% vs RHP | 372 | 9.4% | 16.7% | 9.9% | 34 |