 SF
SF
@
3:40p
 AZ
AZ
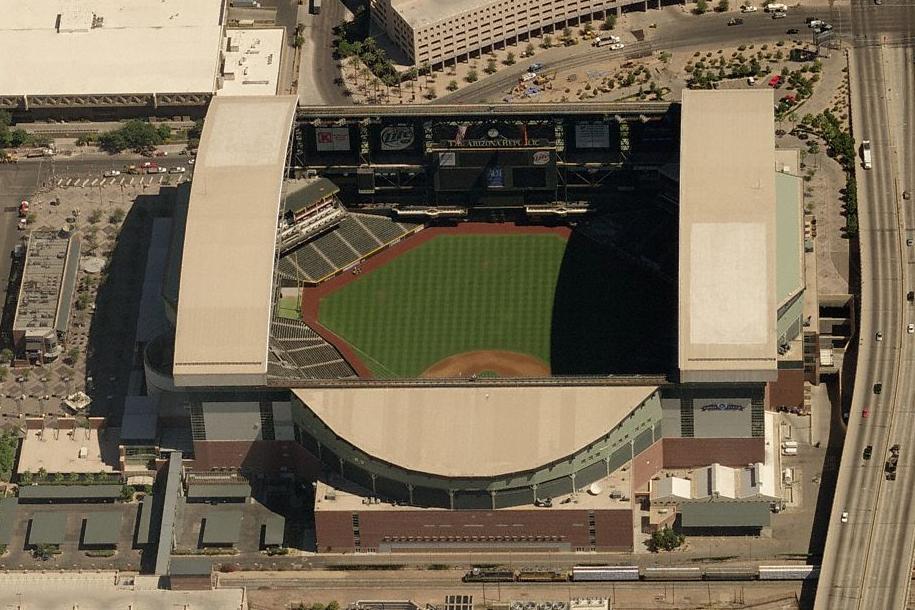
Park Factor
0.86×
Weather Mod
+0.0%
warm air · light crosswind · retractable roof
Combined
0.862
Temp
72.4°F
Wind
4.8 mph
cross
Roof
retractable

9 batters
| # | Batter | Score | Tier | Odds | Form | Rank | ISO ?Isolated Power — career SLG minus AVG. >.220 elite, .180–.220 above avg, <.140 below avg. | EV ?Avg Exit Velocity (mph) — Statcast season-to-date. >92 elite, 89–92 above avg, <86 below avg. | Barrel% ?Barrel rate vs. this pitch mix — percentage of contact classified as barrels (perfect EV + LA combo). >12% elite, 8–12% above avg. | HR/FB ?Batter HR / Fly Ball rate — career, all pitchers. >18% elite, 14–18% above avg, <10% below avg. | HR Dist ?Average distance (ft) of this batter's HRs. >400ft elite raw power, 380–400 above avg. | Sea HR% ?Season HR rate (HRs / PAs so far this year). v3.5 model feature — top backtest contributor. | 14d Pace ?Recent 14-day HR pace (HRs / games started). v3.5 model feature — captures current form. | Match% ?HR/FB Matchup — combined batter × pitcher HR/FB rate. The headline "how favorable is this matchup" number. | BBE ?Sample size — batted-ball events. <30 = small sample, treat stats with caution. | |
|---|---|---|---|---|---|---|---|---|---|---|---|---|---|---|---|---|
| 1 |

|
Ryan Waldschmidt | 69 | 🔵 C+ | · | 🌤️ WARM | 26 | 0.295 | 85.4 | 16.0% | 16.7% | · | 0.0% | 0.0% | 33.0% | 21 |
| 2 |

|
Ketel Marte | 41 | ⚪ D | · | 🌧️ COOL | 123 | 0.152 | 91.9 | 10.3% | 20.8% | 408 | 6.7% | 8.3% | 8.5% | 43 |
| 3 |

|
Ildemaro Vargas | 41 | ⚪ D | · | 🌧️ COOL | 124 | 0.230 | 87.2 | 4.1% | 17.6% | 399 | 12.5% | 7.7% | 12.3% | 50 |
| 4 |

|
Jorge Barrosa | 39 | ⚪ D | · | ❄ COLD | 137 | 0.180 | 85.9 | 7.4% | 11.1% | 351 | 3.6% | 0.0% | 10.8% | 5 |
| 5 |

|
Adrian Del Castillo ⚡ | 39 | ⚪ D | · | · | 140 | 0.151 | 88.6 | 7.9% | 16.7% | 403 | 10.0% | 0.0% | 7.9% | 17 |
| 6 |

|
Lourdes Gurriel Jr. | 30 | ⚪ D | · | 🌧️ COOL | 202 | 0.045 | 87.3 | 5.9% | 10.0% | 379 | 25.0% | 33.3% | 9.7% | 32 |
| 7 |

|
Geraldo Perdomo ⚡ | 27 | ⚪ D | · | · | 209 | 0.135 | 87.6 | 3.0% | 5.3% | 382 | 3.1% | 0.0% | 5.6% | 40 |
| 8 |

|
Tim Tawa | 24 | ⚪ D | · | 🌤️ WARM | 227 | 0.109 | 87.7 | 2.4% | 16.7% | 363 | 0.0% | 0.0% | 12.9% | 5 |
| 9 |

|
Jose Fernandez ⚡ | 21 | ⚪ D | · | ❄ COLD | 237 | 0.111 | 88.3 | 4.3% | 33.3% | 409 | 0.0% | 0.0% | 12.2% | 22 |

9 batters
| # | Batter | Score | Tier | Odds | Form | Rank | ISO ?Isolated Power — career SLG minus AVG. >.220 elite, .180–.220 above avg, <.140 below avg. | EV ?Avg Exit Velocity (mph) — Statcast season-to-date. >92 elite, 89–92 above avg, <86 below avg. | Barrel% ?Barrel rate vs. this pitch mix — percentage of contact classified as barrels (perfect EV + LA combo). >12% elite, 8–12% above avg. | HR/FB ?Batter HR / Fly Ball rate — career, all pitchers. >18% elite, 14–18% above avg, <10% below avg. | HR Dist ?Average distance (ft) of this batter's HRs. >400ft elite raw power, 380–400 above avg. | Sea HR% ?Season HR rate (HRs / PAs so far this year). v3.5 model feature — top backtest contributor. | 14d Pace ?Recent 14-day HR pace (HRs / games started). v3.5 model feature — captures current form. | Match% ?HR/FB Matchup — combined batter × pitcher HR/FB rate. The headline "how favorable is this matchup" number. | BBE ?Sample size — batted-ball events. <30 = small sample, treat stats with caution. | |
|---|---|---|---|---|---|---|---|---|---|---|---|---|---|---|---|---|
| 1 |

|
Casey Schmitt | 57 | 🟠 C | · | 🌧️ COOL | 50 | 0.215 | 90.0 | 14.2% | 21.9% | 388 | 14.0% | 7.7% | 17.7% | 32 |
| 2 |

|
Rafael Devers | 50 | 🟠 C | · | 🌤️ WARM | 86 | 0.148 | 90.5 | 7.8% | 15.4% | 404 | 12.1% | 30.8% | 16.4% | 33 |
| 3 |

|
Willy Adames | 44 | ⚪ D | · | 🌤️ WARM | 110 | 0.123 | 88.7 | 8.9% | 12.5% | 375 | 9.1% | 15.4% | 7.2% | 40 |
| 4 |

|
Daniel Susac | 39 | ⚪ D | · | 🌤️ WARM | 136 | 0.175 | 88.7 | 7.1% | 16.0% | · | 0.0% | 0.0% | 10.2% | 8 |
| 5 |

|
Matt Chapman ⚡ | 26 | ⚪ D | · | · | 213 | 0.082 | 87.2 | 5.3% | 9.1% | 349 | 2.3% | 0.0% | 6.7% | 32 |
| 6 |

|
Will Brennan | 25 | ⚪ D | · | 🌤️ WARM | 223 | 0.149 | 84.5 | · | 7.4% | · | 0.0% | 0.0% | 10.5% | 6 |
| 7 |

|
Luis Arraez | 24 | ⚪ D | · | · | 229 | 0.070 | 87.1 | · | 3.0% | 345 | 4.4% | 15.4% | 6.0% | 48 |
| 8 |

|
Bryce Eldridge | 22 | ⚪ D | · | 🌤️ WARM | 235 | 0.045 | 91.1 | · | 0.0% | 364 | 0.0% | 0.0% | 11.4% | 13 |
| 9 |

|
Drew Gilbert ⚡ | 18 | ⚪ D | · | ❄ COLD | 245 | 0.100 | 83.2 | 3.0% | 25.0% | 380 | 0.0% | 0.0% | 9.1% | 23 |