 PIT
PIT
@
8:05p
 TEX
TEX
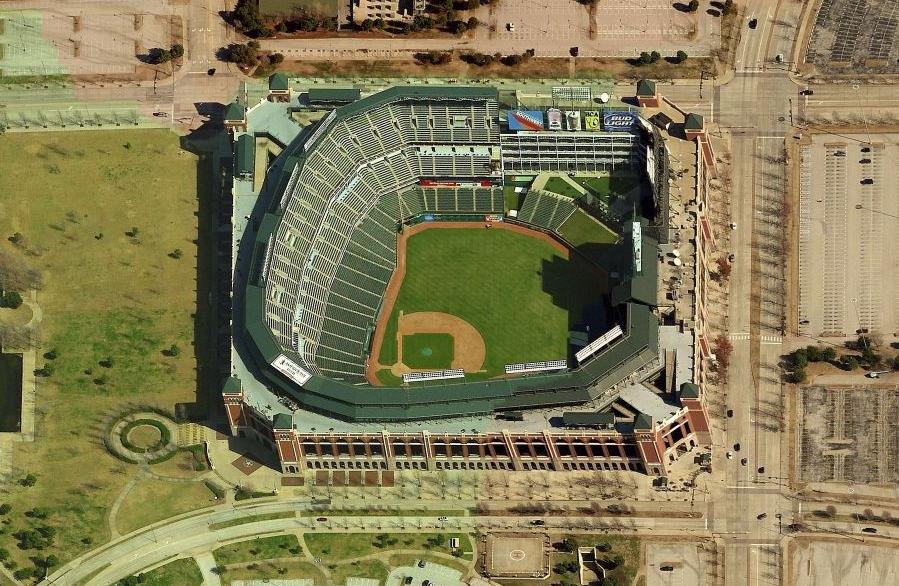
Park Factor
0.77×
Weather Mod
+2.0%
warm air · steady partial wind out · retractable roof
Combined
0.922
Temp
76.5°F
Wind
12.7 mph
slight_out
Roof
retractable

Jacob deGrom
RHP
9 batters
| # | Batter | Score | Tier | Odds | Form | Rank | ISO ?Isolated Power — career SLG minus AVG. >.220 elite, .180–.220 above avg, <.140 below avg. | EV ?Avg Exit Velocity (mph) — Statcast season-to-date. >92 elite, 89–92 above avg, <86 below avg. | Barrel% ?Barrel rate vs. this pitch mix — percentage of contact classified as barrels (perfect EV + LA combo). >12% elite, 8–12% above avg. | HR/FB ?Batter HR / Fly Ball rate — career, all pitchers. >18% elite, 14–18% above avg, <10% below avg. | HR Dist ?Average distance (ft) of this batter's HRs. >400ft elite raw power, 380–400 above avg. | Sea HR% ?Season HR rate (HRs / PAs so far this year). v3.5 model feature — top backtest contributor. | 14d Pace ?Recent 14-day HR pace (HRs / games started). v3.5 model feature — captures current form. | Match% ?HR/FB Matchup — combined batter × pitcher HR/FB rate. The headline "how favorable is this matchup" number. | BBE ?Sample size — batted-ball events. <30 = small sample, treat stats with caution. | |
|---|---|---|---|---|---|---|---|---|---|---|---|---|---|---|---|---|
| 1 |

|
Oneil Cruz | 81 | 🟢 A | · | 🌤️ WARM | 8 | 0.271 | 97.3 | 23.5% | 44.4% | 415 | 33.3% | 37.5% | 29.6% | 35 |
| 2 |

|
Brandon Lowe | 59 | 🟠 C | · | 🌤️ WARM | 32 | 0.292 | 86.5 | 12.3% | 36.8% | 390 | 6.7% | 0.0% | 27.9% | 34 |
| 3 |

|
Ryan O'Hearn | 46 | ⚪ D | · | · | 66 | 0.191 | 90.6 | 8.6% | 21.1% | 385 | 16.7% | 25.0% | 10.8% | 32 |
| 4 |

|
Marcell Ozuna | 36 | ⚪ D | · | 🌤️ WARM | 93 | 0.094 | 88.5 | 9.8% | 11.1% | 405 | 9.5% | 22.2% | 7.2% | 36 |
| 5 |

|
Bryan Reynolds | 36 | ⚪ D | · | 🌧️ COOL | 94 | 0.138 | 91.5 | 9.4% | 20.0% | 405 | 16.7% | 14.3% | 7.6% | 30 |
| 6 |

|
Joey Bart | 31 | ⚪ D | · | 🌤️ WARM | 109 | 0.115 | 85.8 | 9.5% | 9.1% | 383 | 0.0% | 0.0% | 9.1% | 14 |
| 7 |

|
Konnor Griffin | 28 | ⚪ D | · | · | 116 | 0.100 | 86.6 | 10.2% | 9.1% | 386 | 0.0% | 0.0% | 7.9% | 0 |
| 8 |

|
Spencer Horwitz | 28 | ⚪ D | · | 🔥 HOT | 117 | 0.123 | 86.3 | 1.9% | 16.7% | 380 | 0.0% | 0.0% | 9.3% | 30 |
| 9 |

|
Nick Gonzales | 5 | ⚪ D | · | 🌧️ COOL | 160 | 0.037 | 87.3 | 1.5% | 0.0% | · | 0.0% | 0.0% | 5.5% | 31 |

Bubba Chandler
RHP
9 batters
| # | Batter | Score | Tier | Odds | Form | Rank | ISO ?Isolated Power — career SLG minus AVG. >.220 elite, .180–.220 above avg, <.140 below avg. | EV ?Avg Exit Velocity (mph) — Statcast season-to-date. >92 elite, 89–92 above avg, <86 below avg. | Barrel% ?Barrel rate vs. this pitch mix — percentage of contact classified as barrels (perfect EV + LA combo). >12% elite, 8–12% above avg. | HR/FB ?Batter HR / Fly Ball rate — career, all pitchers. >18% elite, 14–18% above avg, <10% below avg. | HR Dist ?Average distance (ft) of this batter's HRs. >400ft elite raw power, 380–400 above avg. | Sea HR% ?Season HR rate (HRs / PAs so far this year). v3.5 model feature — top backtest contributor. | 14d Pace ?Recent 14-day HR pace (HRs / games started). v3.5 model feature — captures current form. | Match% ?HR/FB Matchup — combined batter × pitcher HR/FB rate. The headline "how favorable is this matchup" number. | BBE ?Sample size — batted-ball events. <30 = small sample, treat stats with caution. | |
|---|---|---|---|---|---|---|---|---|---|---|---|---|---|---|---|---|
| 1 |

|
Corey Seager | 61 | 🔵 C+ | · | ❄ COLD | 27 | 0.242 | 90.4 | 15.2% | 31.6% | 402 | 22.2% | 14.3% | 18.6% | 33 |
| 2 |

|
Brandon Nimmo | 58 | 🟠 C | · | · | 34 | 0.199 | 90.8 | 12.3% | 20.0% | 396 | 15.8% | 22.2% | 15.8% | 42 |
| 3 |

|
Josh Jung | 56 | 🟠 C | · | 🌤️ WARM | 39 | 0.217 | 91.0 | 2.9% | 21.4% | 373 | 15.8% | 37.5% | 17.2% | 42 |
| 4 |

|
Evan Carter | 49 | ⚪ D | · | 🌧️ COOL | 57 | 0.167 | 90.2 | 10.2% | 15.0% | 381 | 20.0% | 20.0% | 10.8% | 32 |
| 5 |

|
Jake Burger | 44 | ⚪ D | · | 🌧️ COOL | 69 | 0.182 | 88.5 | 9.5% | 29.4% | 404 | 10.5% | 0.0% | 17.6% | 38 |
| 6 |

|
Danny Jansen | 26 | ⚪ D | · | 🌧️ COOL | 124 | 0.121 | 87.2 | 5.3% | 14.3% | 409 | 0.0% | 0.0% | 6.6% | 16 |
| 7 |

|
Joc Pederson | 21 | ⚪ D | · | · | 136 | 0.069 | 93.2 | 0.0% | 7.1% | 361 | 0.0% | 0.0% | 5.9% | 17 |
| 8 |

|
Josh Smith | 21 | ⚪ D | · | · | 137 | 0.027 | 88.0 | 6.7% | 0.0% | · | 0.0% | 0.0% | 4.8% | 28 |
| 9 |

|
Alejandro Osuna | 17 | ⚪ D | · | 🌤️ WARM | 148 | · | 85.5 | 5.6% | 0.0% | 394 | 0.0% | 0.0% | 8.5% | 4 |