 HOU
HOU
@
—
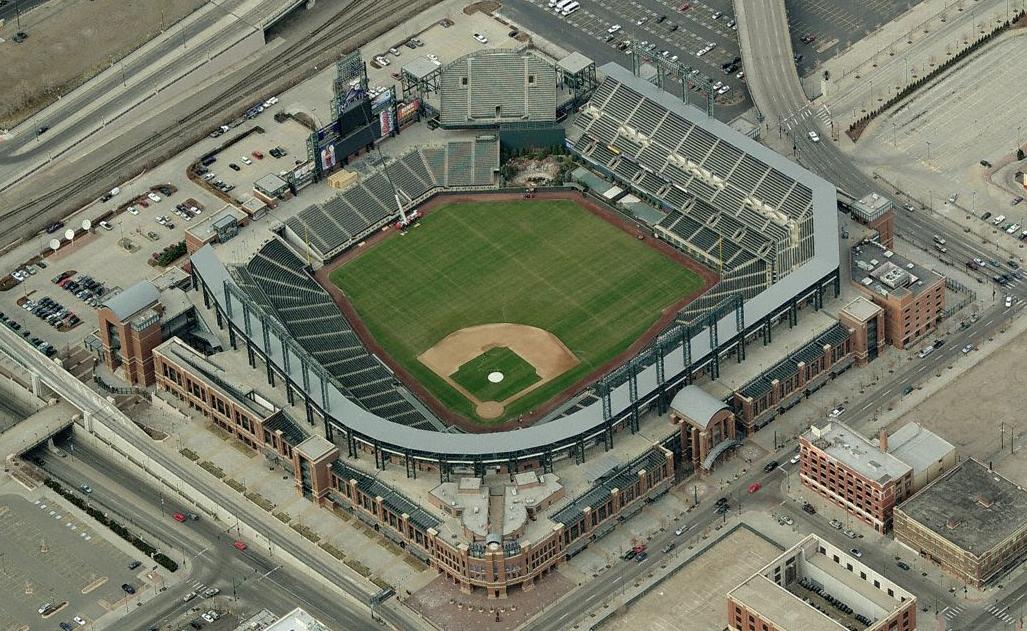
 COL
COL
Park Factor
1.17×
Weather Mod
-3.0%
cold air · light crosswind · roof open
Combined
0.819
Temp
36.6°F
Wind
3.5 mph
cross
Roof
open

Mike Burrows
RHP
9 batters
| # | Batter | Score | Tier | Odds | Form | Rank | ISO ?Isolated Power — career SLG minus AVG. >.220 elite, .180–.220 above avg, <.140 below avg. | EV ?Avg Exit Velocity (mph) — Statcast season-to-date. >92 elite, 89–92 above avg, <86 below avg. | Barrel% ?Barrel rate vs. this pitch mix — percentage of contact classified as barrels (perfect EV + LA combo). >12% elite, 8–12% above avg. | HR/FB ?Batter HR / Fly Ball rate — career, all pitchers. >18% elite, 14–18% above avg, <10% below avg. | HR Dist ?Average distance (ft) of this batter's HRs. >400ft elite raw power, 380–400 above avg. | Sea HR% ?Season HR rate (HRs / PAs so far this year). v3.5 model feature — top backtest contributor. | 14d Pace ?Recent 14-day HR pace (HRs / games started). v3.5 model feature — captures current form. | Match% ?HR/FB Matchup — combined batter × pitcher HR/FB rate. The headline "how favorable is this matchup" number. | BBE ?Sample size — batted-ball events. <30 = small sample, treat stats with caution. | |
|---|---|---|---|---|---|---|---|---|---|---|---|---|---|---|---|---|
| 1 |

|
Mickey Moniak | 76 | 🟡 B | · | 🌤️ WARM | 5 | 0.249 | 89.7 | 12.2% | 16.8% | 411 | 16.7% | 16.7% | 32.6% | 10 |
| 2 |

|
Hunter Goodman | 65 | 🔵 C+ | · | 🌧️ COOL | 16 | 0.243 | 90.8 | 11.8% | 18.6% | 409 | 12.5% | 12.5% | 20.1% | 26 |
| 3 |

|
Ezequiel Tovar | 53 | 🟠 C | · | · | 49 | 0.147 | 89.4 | 10.0% | 9.0% | 406 | 12.5% | 12.5% | 12.2% | 28 |
| 4 |

|
Michael Toglia | 51 | 🟠 C | · | 🌤️ WARM | 60 | 0.163 | 89.9 | 10.5% | 15.3% | 413 | 0.0% | 0.0% | 15.3% | 1 |
| 5 |

|
Jordan Beck | 45 | ⚪ D | · | 🌧️ COOL | 98 | 0.158 | 87.4 | 10.2% | 12.2% | 414 | 0.0% | 0.0% | 10.6% | 18 |
| 6 |

|
Brenton Doyle | 45 | ⚪ D | · | 🌧️ COOL | 99 | 0.143 | 89.9 | 10.8% | 11.2% | 408 | 0.0% | 0.0% | 9.2% | 22 |
| 7 |

|
Kyle Farmer | 43 | ⚪ D | · | ❄ COLD | 114 | 0.137 | 87.0 | 8.1% | 10.7% | 397 | 0.0% | 0.0% | 10.8% | 6 |
| 8 |

|
Tyler Freeman | 32 | ⚪ D | · | ❄ COLD | 190 | 0.080 | 90.1 | 4.8% | 2.3% | 410 | 0.0% | 0.0% | 4.8% | 5 |
| 9 |

|
Ryan Ritter | 31 | ⚪ D | · | 🌤️ WARM | 193 | 0.096 | 85.2 | 4.0% | 3.1% | 354 | 0.0% | 0.0% | 5.5% | 6 |

Kyle Freeland
LHP
9 batters
| # | Batter | Score | Tier | Odds | Form | Rank | ISO ?Isolated Power — career SLG minus AVG. >.220 elite, .180–.220 above avg, <.140 below avg. | EV ?Avg Exit Velocity (mph) — Statcast season-to-date. >92 elite, 89–92 above avg, <86 below avg. | Barrel% ?Barrel rate vs. this pitch mix — percentage of contact classified as barrels (perfect EV + LA combo). >12% elite, 8–12% above avg. | HR/FB ?Batter HR / Fly Ball rate — career, all pitchers. >18% elite, 14–18% above avg, <10% below avg. | HR Dist ?Average distance (ft) of this batter's HRs. >400ft elite raw power, 380–400 above avg. | Sea HR% ?Season HR rate (HRs / PAs so far this year). v3.5 model feature — top backtest contributor. | 14d Pace ?Recent 14-day HR pace (HRs / games started). v3.5 model feature — captures current form. | Match% ?HR/FB Matchup — combined batter × pitcher HR/FB rate. The headline "how favorable is this matchup" number. | BBE ?Sample size — batted-ball events. <30 = small sample, treat stats with caution. | |
|---|---|---|---|---|---|---|---|---|---|---|---|---|---|---|---|---|
| 1 |

|
Christian Walker | 69 | 🔵 C+ | · | 🔥 HOT | 11 | 0.183 | 90.9 | 11.0% | 14.7% | 396 | 20.0% | 20.0% | 14.5% | 35 |
| 2 |

|
Jose Altuve | 62 | 🔵 C+ | · | 🔥 HOT | 28 | 0.177 | 85.1 | 7.6% | 13.6% | 384 | 10.0% | 10.0% | 15.8% | 30 |
| 3 |

|
Cam Smith | 60 | 🔵 C+ | · | 🌤️ WARM | 34 | 0.122 | 87.9 | 8.1% | 9.6% | 395 | 30.0% | 30.0% | 12.3% | 26 |
| 4 |

|
Victor Caratini | 48 | ⚪ D | · | 🌤️ WARM | 86 | 0.145 | 88.7 | 8.5% | 11.0% | 387 | 0.0% | 0.0% | 8.6% | 27 |
| 5 |

|
Mauricio Dubon | 48 | ⚪ D | · | 🔥 HOT | 87 | 0.114 | 84.5 | 3.4% | 5.5% | 384 | 11.1% | 11.1% | 7.2% | 31 |
| 6 |

|
Isaac Paredes | 45 | ⚪ D | · | ❄ COLD | 96 | 0.204 | 87.4 | 7.7% | 14.0% | 375 | 0.0% | 0.0% | 13.7% | 16 |
| 7 |

|
Jeremy Pena | 43 | ⚪ D | · | ❄ COLD | 112 | 0.172 | 88.9 | 8.8% | 12.8% | 380 | 0.0% | 0.0% | 11.0% | 23 |
| 8 |

|
Yainer Diaz | 43 | ⚪ D | · | ❄ COLD | 115 | 0.161 | 89.9 | 9.5% | 12.7% | 395 | 0.0% | 0.0% | 10.3% | 32 |
| 9 |

|
Jake Meyers | 43 | ⚪ D | · | 🌤️ WARM | 123 | 0.082 | 88.1 | 6.9% | 3.8% | 378 | 11.1% | 11.1% | 4.6% | 27 |