 NYM
NYM
@
2:20p
 CHC
CHC
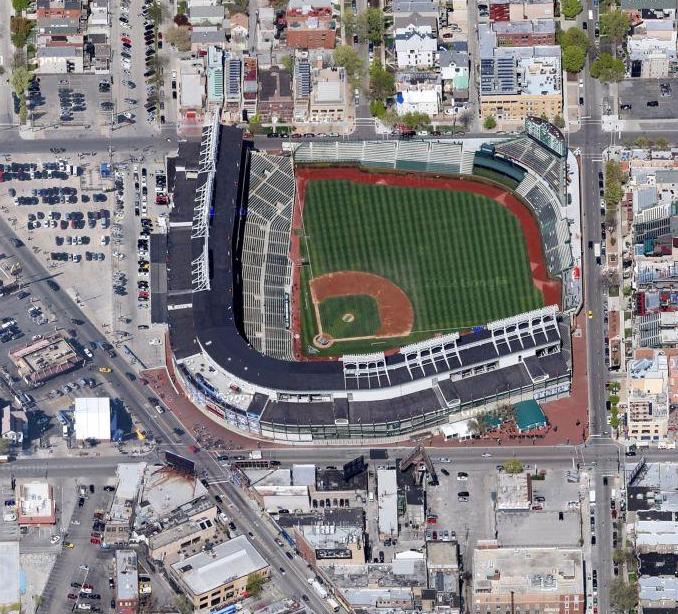
Park Factor
1.04×
Weather Mod
+2.0%
cold air · steady wind out · roof open
Combined
1.249
Temp
47.2°F
Wind
13.3 mph
out
Roof
open

Freddy Peralta
RHP
9 batters
| # | Batter | Score | Tier | Odds | Form | Rank | ISO ?Isolated Power — career SLG minus AVG. >.220 elite, .180–.220 above avg, <.140 below avg. | EV ?Avg Exit Velocity (mph) — Statcast season-to-date. >92 elite, 89–92 above avg, <86 below avg. | Barrel% ?Barrel rate vs. this pitch mix — percentage of contact classified as barrels (perfect EV + LA combo). >12% elite, 8–12% above avg. | HR/FB ?Batter HR / Fly Ball rate — career, all pitchers. >18% elite, 14–18% above avg, <10% below avg. | HR Dist ?Average distance (ft) of this batter's HRs. >400ft elite raw power, 380–400 above avg. | Sea HR% ?Season HR rate (HRs / PAs so far this year). v3.5 model feature — top backtest contributor. | 14d Pace ?Recent 14-day HR pace (HRs / games started). v3.5 model feature — captures current form. | Match% ?HR/FB Matchup — combined batter × pitcher HR/FB rate. The headline "how favorable is this matchup" number. | BBE ?Sample size — batted-ball events. <30 = small sample, treat stats with caution. | |
|---|---|---|---|---|---|---|---|---|---|---|---|---|---|---|---|---|
| 1 |

|
Moisés Ballesteros | 84 | 🟢 A | · | 🌤️ WARM | 13 | 0.250 | 93.8 | 16.7% | 30.0% | 403 | 25.0% | 50.0% | 33.0% | 20 |
| 2 |

|
Ian Happ | 82 | 🟢 A | · | · | 14 | 0.272 | 90.9 | 18.4% | 35.7% | 377 | 33.3% | 25.0% | 31.9% | 27 |
| 3 |

|
Dansby Swanson ⚡ | 69 | 🔵 C+ | · | · | 42 | 0.209 | 90.7 | 13.5% | 25.0% | 377 | 22.2% | 33.3% | 28.1% | 31 |
| 4 |

|
Matt Shaw | 60 | 🔵 C+ | · | · | 64 | 0.212 | 87.6 | 8.1% | 18.2% | 361 | 20.0% | 30.0% | 23.8% | 26 |
| 5 |

|
Carson Kelly ⚡ | 47 | ⚪ D | · | 🌧️ COOL | 109 | 0.122 | 95.2 | 13.5% | 11.1% | 422 | 6.2% | 9.1% | 8.8% | 25 |
| 6 |

|
Nico Hoerner ⚡ | 45 | ⚪ D | · | · | 123 | 0.211 | 84.6 | 0.0% | 17.6% | 369 | 16.7% | 25.0% | 19.9% | 47 |
| 7 |

|
Pete Crow-Armstrong | 32 | ⚪ D | · | 🌤️ WARM | 192 | 0.066 | 91.8 | 4.3% | 7.1% | 389 | 5.6% | 8.3% | 8.2% | 33 |
| 8 |

|
Alex Bregman | 28 | ⚪ D | · | ❄ COLD | 211 | 0.088 | 90.7 | 6.7% | 13.3% | 388 | 6.2% | 0.0% | 9.0% | 41 |
| 9 |

|
Michael Busch | 18 | ⚪ D | · | 🌧️ COOL | 247 | 0.031 | 84.7 | 4.5% | 0.0% | · | 0.0% | 0.0% | 7.1% | 30 |

9 batters
| # | Batter | Score | Tier | Odds | Form | Rank | ISO ?Isolated Power — career SLG minus AVG. >.220 elite, .180–.220 above avg, <.140 below avg. | EV ?Avg Exit Velocity (mph) — Statcast season-to-date. >92 elite, 89–92 above avg, <86 below avg. | Barrel% ?Barrel rate vs. this pitch mix — percentage of contact classified as barrels (perfect EV + LA combo). >12% elite, 8–12% above avg. | HR/FB ?Batter HR / Fly Ball rate — career, all pitchers. >18% elite, 14–18% above avg, <10% below avg. | HR Dist ?Average distance (ft) of this batter's HRs. >400ft elite raw power, 380–400 above avg. | Sea HR% ?Season HR rate (HRs / PAs so far this year). v3.5 model feature — top backtest contributor. | 14d Pace ?Recent 14-day HR pace (HRs / games started). v3.5 model feature — captures current form. | Match% ?HR/FB Matchup — combined batter × pitcher HR/FB rate. The headline "how favorable is this matchup" number. | BBE ?Sample size — batted-ball events. <30 = small sample, treat stats with caution. | |
|---|---|---|---|---|---|---|---|---|---|---|---|---|---|---|---|---|
| 1 |

|
Francisco Alvarez | 69 | 🔵 C+ | · | ❄ COLD | 40 | 0.255 | 89.6 | 22.2% | 40.0% | 415 | 0.0% | 0.0% | 23.7% | 24 |
| 2 |

|
Francisco Lindor | 45 | ⚪ D | · | · | 119 | 0.113 | 89.1 | 8.6% | 7.1% | 402 | 5.9% | 10.0% | 9.2% | 42 |
| 3 | Luis Robert Jr. | 45 | ⚪ D | · | 🌤️ WARM | 121 | 0.113 | 89.5 | 5.0% | 20.0% | 400 | 25.0% | 0.0% | 10.8% | 26 | |
| 4 |

|
Jorge Polanco | 41 | ⚪ D | · | 🌤️ WARM | 141 | 0.107 | 87.3 | 4.4% | 10.0% | 346 | 5.6% | 11.1% | 9.7% | 25 |
| 5 |

|
Carson Benge | 39 | ⚪ D | · | 🔥 HOT | 152 | 0.070 | 89.9 | 2.9% | 12.5% | 385 | 0.0% | 0.0% | 10.0% | 25 |
| 6 |

|
Brett Baty | 34 | ⚪ D | · | 🌧️ COOL | 183 | 0.082 | 90.8 | 7.7% | 0.0% | · | 0.0% | 0.0% | 8.5% | 23 |
| 7 |

|
Mark Vientos | 32 | ⚪ D | · | 🌧️ COOL | 194 | 0.109 | 87.2 | 2.9% | 9.1% | 406 | 8.3% | 0.0% | 9.6% | 27 |
| 8 |

|
Marcus Semien | 31 | ⚪ D | · | 🌧️ COOL | 197 | 0.085 | 86.7 | 5.9% | 4.3% | 407 | 0.0% | 0.0% | 8.3% | 36 |
| 9 |

|
Bo Bichette ⚡ | 28 | ⚪ D | · | 🌧️ COOL | 213 | 0.072 | 90.4 | 1.8% | 11.1% | 344 | 5.9% | 10.0% | 9.9% | 36 |