 LAA
LAA
@
1:10p
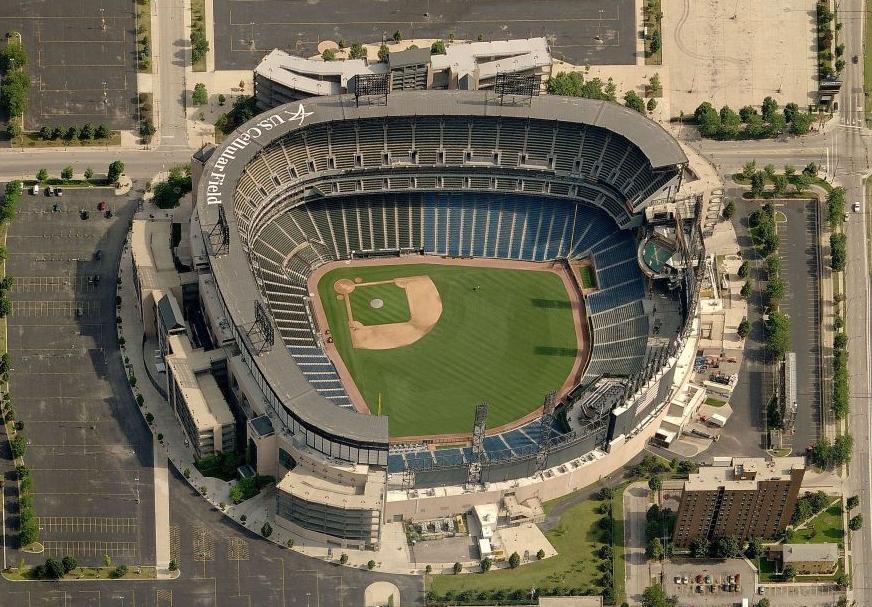
 CWS
CWS
Park Factor
0.92×
Weather Mod
+0.0%
Unknown stadium
Combined
0.919

Erick Fedde
RHP
9 batters
| # | Batter | Score | Tier | Odds | Form | Rank | ISO ?Isolated Power — career SLG minus AVG. >.220 elite, .180–.220 above avg, <.140 below avg. | EV ?Avg Exit Velocity (mph) — Statcast season-to-date. >92 elite, 89–92 above avg, <86 below avg. | Barrel% ?Barrel rate vs. this pitch mix — percentage of contact classified as barrels (perfect EV + LA combo). >12% elite, 8–12% above avg. | HR/FB ?Batter HR / Fly Ball rate — career, all pitchers. >18% elite, 14–18% above avg, <10% below avg. | HR Dist ?Average distance (ft) of this batter's HRs. >400ft elite raw power, 380–400 above avg. | Sea HR% ?Season HR rate (HRs / PAs so far this year). v3.5 model feature — top backtest contributor. | 14d Pace ?Recent 14-day HR pace (HRs / games started). v3.5 model feature — captures current form. | Match% ?HR/FB Matchup — combined batter × pitcher HR/FB rate. The headline "how favorable is this matchup" number. | BBE ?Sample size — batted-ball events. <30 = small sample, treat stats with caution. | |
|---|---|---|---|---|---|---|---|---|---|---|---|---|---|---|---|---|
| 1 |

|
Mike Trout | 86 | 🟢 A | · | · | 9 | 0.304 | 91.3 | 24.6% | 29.2% | 420 | 22.2% | 25.0% | 34.8% | 32 |
| 2 |

|
Jorge Soler | 62 | 🔵 C+ | · | · | 51 | 0.234 | 89.3 | 11.8% | 54.5% | 390 | 19.2% | 9.1% | 22.9% | 22 |
| 3 |

|
Oswald Peraza | 54 | 🟠 C | · | · | 77 | 0.197 | 88.7 | 11.3% | 20.0% | 378 | 15.4% | 8.3% | 13.8% | 24 |
| 4 |

|
Zach Neto | 51 | 🟠 C | · | · | 96 | 0.184 | 89.4 | 11.3% | 17.4% | 397 | 14.8% | 0.0% | 13.0% | 32 |
| 5 |

|
Josh Lowe | 46 | ⚪ D | · | · | 123 | 0.178 | 86.2 | 6.7% | 19.1% | 365 | 14.3% | 18.2% | 14.2% | 26 |
| 6 |

|
Yoán Moncada | 43 | ⚪ D | · | 🌤️ WARM | 139 | 0.139 | 90.7 | 7.5% | 18.8% | 373 | 9.1% | 10.0% | 7.0% | 21 |
| 7 |

|
Jo Adell | 35 | ⚪ D | · | · | 183 | 0.111 | 90.8 | 4.6% | 0.0% | 404 | 11.1% | 16.7% | 5.8% | 40 |
| 8 |

|
Logan O'Hoppe | 32 | ⚪ D | · | 🌤️ WARM | 199 | 0.051 | 87.6 | 9.3% | 11.1% | 427 | 0.0% | 0.0% | 11.1% | 15 |
| 9 |

|
Nolan Schanuel | 32 | ⚪ D | · | · | 202 | 0.134 | 86.9 | 2.4% | 15.4% | 364 | 11.1% | 8.3% | 6.5% | 43 |

Yusei Kikuchi
LHP
9 batters
| # | Batter | Score | Tier | Odds | Form | Rank | ISO ?Isolated Power — career SLG minus AVG. >.220 elite, .180–.220 above avg, <.140 below avg. | EV ?Avg Exit Velocity (mph) — Statcast season-to-date. >92 elite, 89–92 above avg, <86 below avg. | Barrel% ?Barrel rate vs. this pitch mix — percentage of contact classified as barrels (perfect EV + LA combo). >12% elite, 8–12% above avg. | HR/FB ?Batter HR / Fly Ball rate — career, all pitchers. >18% elite, 14–18% above avg, <10% below avg. | HR Dist ?Average distance (ft) of this batter's HRs. >400ft elite raw power, 380–400 above avg. | Sea HR% ?Season HR rate (HRs / PAs so far this year). v3.5 model feature — top backtest contributor. | 14d Pace ?Recent 14-day HR pace (HRs / games started). v3.5 model feature — captures current form. | Match% ?HR/FB Matchup — combined batter × pitcher HR/FB rate. The headline "how favorable is this matchup" number. | BBE ?Sample size — batted-ball events. <30 = small sample, treat stats with caution. | |
|---|---|---|---|---|---|---|---|---|---|---|---|---|---|---|---|---|
| 1 |

|
Colson Montgomery | 77 | 🟡 B | · | 🌤️ WARM | 21 | 0.273 | 89.3 | 15.0% | 50.0% | 402 | 35.7% | 36.4% | 35.9% | 27 |
| 2 |

|
Munetaka Murakami | 72 | 🟡 B | · | · | 25 | 0.333 | 96.4 | 25.5% | 46.2% | 415 | 0.0% | 0.0% | 25.4% | 0 |
| 3 |

|
Miguel Vargas | 69 | 🔵 C+ | · | 🌤️ WARM | 32 | 0.233 | 88.6 | 13.2% | 44.4% | 394 | 26.7% | 33.3% | 32.2% | 38 |
| 4 |

|
Andrew Benintendi | 52 | 🟠 C | · | · | 91 | 0.169 | 89.9 | 12.2% | 10.0% | 391 | 16.7% | 20.0% | 11.9% | 31 |
| 5 |

|
Everson Pereira | 51 | 🟠 C | · | ❄ COLD | 97 | 0.203 | 89.1 | 14.3% | 27.3% | 407 | 18.2% | 10.0% | 12.6% | 31 |
| 6 |

|
Chase Meidroth | 21 | ⚪ D | · | · | 239 | 0.076 | 88.9 | 4.2% | 0.0% | 417 | 0.0% | 0.0% | 5.5% | 34 |
| 7 |

|
Luisangel Acuña | 20 | ⚪ D | · | 🌤️ WARM | 242 | 0.014 | 88.3 | 3.5% | 0.0% | · | 0.0% | 0.0% | 5.8% | 17 |
| 8 |

|
Tristan Peters | 18 | ⚪ D | · | · | 249 | 0.045 | 87.6 | 4.9% | 0.0% | · | 0.0% | 0.0% | 6.1% | 21 |
| 9 |

|
Edgar Quero | 9 | ⚪ D | · | 🌧️ COOL | 260 | 0.016 | 89.9 | 0.0% | 0.0% | · | 0.0% | 0.0% | 5.8% | 20 |