 AZ
AZ
@
10:10p
 SEA
SEA
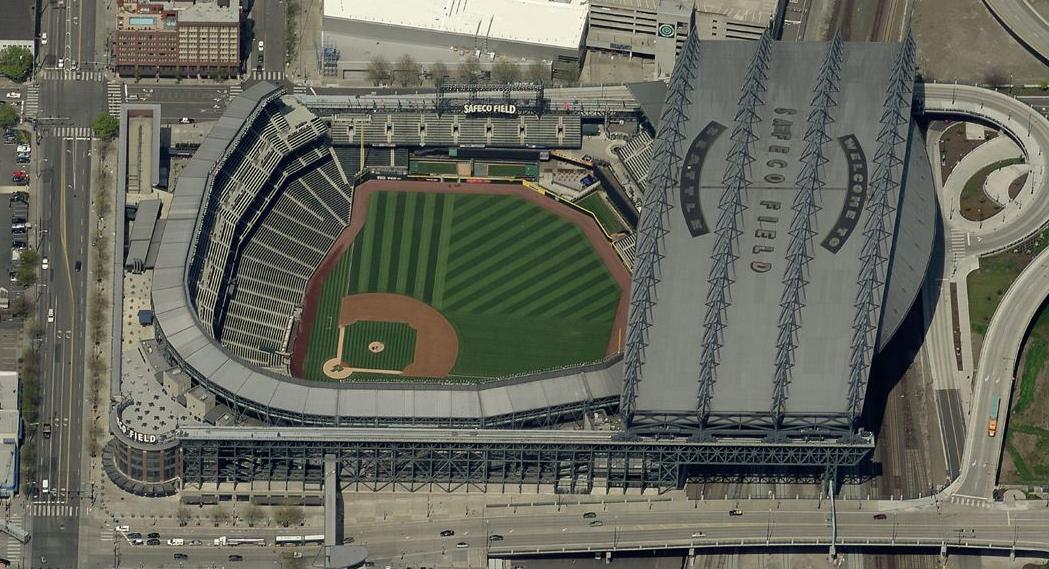
Park Factor
1.09×
Weather Mod
-1.0%
cool air · light wind out · retractable roof
Combined
0.978
Temp
59.6°F
Wind
6.0 mph
out
Roof
retractable

Ryne Nelson
RHP
9 batters
| # | Batter | Score | Tier | Odds | Form | Rank | ISO ?Isolated Power — career SLG minus AVG. >.220 elite, .180–.220 above avg, <.140 below avg. | EV ?Avg Exit Velocity (mph) — Statcast season-to-date. >92 elite, 89–92 above avg, <86 below avg. | Barrel% ?Barrel rate vs. this pitch mix — percentage of contact classified as barrels (perfect EV + LA combo). >12% elite, 8–12% above avg. | HR/FB ?Batter HR / Fly Ball rate — career, all pitchers. >18% elite, 14–18% above avg, <10% below avg. | HR Dist ?Average distance (ft) of this batter's HRs. >400ft elite raw power, 380–400 above avg. | Sea HR% ?Season HR rate (HRs / PAs so far this year). v3.5 model feature — top backtest contributor. | 14d Pace ?Recent 14-day HR pace (HRs / games started). v3.5 model feature — captures current form. | Match% ?HR/FB Matchup — combined batter × pitcher HR/FB rate. The headline "how favorable is this matchup" number. | BBE ?Sample size — batted-ball events. <30 = small sample, treat stats with caution. | |
|---|---|---|---|---|---|---|---|---|---|---|---|---|---|---|---|---|
| 1 |

|
Luke Raley | 75 | 🟡 B | +425 | ❄ COLD | 12 | 0.278 | 91.6 | 14.6% | 39.3% | 384 | 21.1% | 20.0% | 34.8% | 21 |
| 2 |

|
Dominic Canzone | 65 | 🔵 C+ | +425 | · | 31 | 0.228 | 93.1 | 12.3% | 25.0% | 401 | 7.1% | 10.0% | 21.2% | 16 |
| 3 |

|
Julio Rodríguez | 63 | 🔵 C+ | · | · | 38 | 0.184 | 90.4 | 9.5% | 14.3% | 411 | 23.1% | 36.4% | 20.6% | 46 |
| 4 |

|
J. P. Crawford | 63 | 🔵 C+ | · | 🌤️ WARM | 41 | 0.147 | 88.1 | 9.8% | 30.0% | 385 | 100.0% | 100.0% | 19.2% | 29 |
| 5 |

|
Randy Arozarena | 57 | 🟠 C | +525 | 🌤️ WARM | 70 | 0.175 | 91.1 | 8.5% | 20.0% | 389 | 9.3% | 18.2% | 14.9% | 34 |
| 6 |

|
Cal Raleigh | 54 | 🟠 C | · | · | 86 | 0.157 | 87.5 | 11.3% | 14.6% | 390 | 14.9% | 0.0% | 12.5% | 0 |
| 7 |

|
Cole Young | 39 | ⚪ D | +850 | 🌧️ COOL | 183 | 0.133 | 87.9 | 7.7% | 6.7% | 395 | 5.6% | 0.0% | 7.6% | 34 |
| 8 |

|
Josh Naylor | 34 | ⚪ D | +425 | ❄ COLD | 208 | 0.097 | 87.6 | 7.9% | 15.6% | 402 | 7.9% | 0.0% | 8.6% | 41 |
| 9 |

|
Leo Rivas | 25 | ⚪ D | · | 🌤️ WARM | 238 | 0.038 | 86.2 | 3.9% | 0.0% | · | 0.0% | 0.0% | 8.2% | 3 |

Bryan Woo
RHP
9 batters
| # | Batter | Score | Tier | Odds | Form | Rank | ISO ?Isolated Power — career SLG minus AVG. >.220 elite, .180–.220 above avg, <.140 below avg. | EV ?Avg Exit Velocity (mph) — Statcast season-to-date. >92 elite, 89–92 above avg, <86 below avg. | Barrel% ?Barrel rate vs. this pitch mix — percentage of contact classified as barrels (perfect EV + LA combo). >12% elite, 8–12% above avg. | HR/FB ?Batter HR / Fly Ball rate — career, all pitchers. >18% elite, 14–18% above avg, <10% below avg. | HR Dist ?Average distance (ft) of this batter's HRs. >400ft elite raw power, 380–400 above avg. | Sea HR% ?Season HR rate (HRs / PAs so far this year). v3.5 model feature — top backtest contributor. | 14d Pace ?Recent 14-day HR pace (HRs / games started). v3.5 model feature — captures current form. | Match% ?HR/FB Matchup — combined batter × pitcher HR/FB rate. The headline "how favorable is this matchup" number. | BBE ?Sample size — batted-ball events. <30 = small sample, treat stats with caution. | |
|---|---|---|---|---|---|---|---|---|---|---|---|---|---|---|---|---|
| 1 |

|
Corbin Carroll | 63 | 🔵 C+ | +390 | 🌤️ WARM | 42 | 0.251 | 91.1 | 10.0% | 24.0% | 417 | 11.4% | 9.1% | 18.0% | 38 |
| 2 |

|
Ketel Marte | 59 | 🟠 C | +390 | 🌤️ WARM | 56 | 0.197 | 90.9 | 9.2% | 19.4% | 415 | 10.5% | 27.3% | 21.7% | 48 |
| 3 |

|
Gabriel Moreno | 55 | 🟠 C | +750 | · | 81 | 0.204 | 89.3 | 9.6% | 13.0% | 410 | 7.7% | 25.0% | 15.9% | 30 |
| 4 |

|
Nolan Arenado | 51 | 🟠 C | +750 | 🌤️ WARM | 103 | 0.199 | 85.6 | 7.0% | 17.2% | 401 | 12.5% | 10.0% | 12.2% | 30 |
| 5 |

|
Ildemaro Vargas | 41 | ⚪ D | +950 | 🌧️ COOL | 166 | 0.195 | 87.0 | 5.5% | 13.6% | 399 | 10.3% | 0.0% | 11.8% | 45 |
| 6 |

|
Adrian Del Castillo | 39 | ⚪ D | +500 | 🌧️ COOL | 181 | 0.140 | 88.4 | 7.0% | 18.2% | 396 | 11.1% | 10.0% | 9.0% | 21 |
| 7 |

|
Alek Thomas | 37 | ⚪ D | · | ❄ COLD | 189 | 0.175 | 89.9 | 7.9% | 12.5% | 408 | 3.1% | 0.0% | 10.0% | 13 |
| 8 |

|
Geraldo Perdomo | 33 | ⚪ D | +750 | · | 216 | 0.108 | 87.3 | 5.3% | 4.2% | 372 | 5.0% | 8.3% | 6.8% | 45 |
| 9 |

|
Jose Fernandez ⚡ | 23 | ⚪ D | · | ❄ COLD | 244 | 0.097 | 88.0 | 5.1% | 25.0% | 409 | 0.0% | 0.0% | 8.8% | 31 |