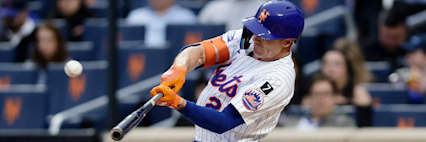

Jared Young
LHB2
HRs ?Total home runs hit while this batter appeared in the model's scored pool this season.
11.8%
HR Rate ?Percentage of scored appearances where this batter hit a home run. Higher = more reliable power output.
17.1%
Avg HR/FB ?Average HR-per-fly-ball rate across appearances. Measures how often fly balls leave the yard — above 16% is elite, above 12% is strong.
90.3
Avg EV ?Average exit velocity (mph) on batted balls. Hard contact is the best predictor of HR power — 92+ is elite, 89+ is strong.
0.146
ISO ?Isolated Power — measures raw extra-base-hit ability (SLG minus AVG). .220+ is elite power, .180+ is above average.
#18
Best Rank ?Highest model ranking this batter has achieved on a single slate. #1 means the model rated them the top HR candidate that day.
HR Profile
?Statcast-style HR metrics for this batter — same fields the model scores on. Red = elite, orange = above average, blue = below average, grey = no data.
Season-to-date · live-tape thresholds
0.202
ISO ?Isolated Power (SLG − AVG). >.220 elite, .180–.220 above avg, <.140 below avg.
79th pctile
89.9
Avg EV (mph) ?Average exit velocity (mph) on all batted balls. >92 elite, 89–92 above avg.
62th pctile
12.0%
Barrel% ?Percentage of contact classified as barrels (perfect EV+LA combo). >12% elite.
90th pctile
25.0% vs RHP
HR/FB ?Home runs per fly ball for this matchup. A vs LHP/vs RHP chip means a handedness split is shown; otherwise the value is overall.
92th pctile
401
Avg HR Dist (ft) ?Average distance of this batter's HRs in feet. >400 elite raw power.
71th pctile
14.3%
Season HR% ?HRs ÷ plate appearances this season. v3.5 model feature — strongest single backtest contributor.
12.5%
14d Pace ?HRs per game over last 14 days. v3.5 model feature — captures current hot/cold streak.
24.0%
Match% ?Combined batter × pitcher HR/FB rate — the headline "how favorable is this matchup" number.
95th pctile
33
BBE ?Batted-ball events — sample size. Treat stats with caution below 30.
17
Appearances ?Total times this batter has appeared in the model's daily scored pool this season.
8
Top-50 Days ?Number of days this batter ranked in the top 50 on the slate. Top-50 is the model's primary recommendation zone.
1
HRs in Top 50 ?Home runs hit on days when the model ranked this batter in the top 50. Measures how often the model correctly surfaced this batter before they went deep.
50%
Catch Rate ?Percentage of this batter's HRs that occurred when the model had them ranked in the top 50. Higher = model does a good job timing this batter. 60%+ is excellent.
#87.5
Avg Rank ?This batter's average model rank across all appearances. Lower = the model consistently rates them highly.
Rank Trend ?Daily model rank over time. The Y-axis is inverted — lower on the chart = better rank. Green dots mark days this batter hit a home run.
HR Days (While Top 50) ?Every HR this batter hit on a day the model ranked them in the top 50. Shows the matchup conditions that led to each homer — pitcher, stadium, exit velocity, and distance.
| Date | Rank | Pitcher | Stadium | B/P | WT | BP | EV | Distance |
|---|---|---|---|---|---|---|---|---|
| 2026-06-11 | #24 | Hunter Dobbins | Citi Field | L/R | ⚠️ | 105.6 mph | 390 ft |
All Appearances ?Complete log of every time this batter appeared on the scored slate. Includes model rank, tier, form trend, and whether they went yard. Rows highlighted in green = HR days.
| Date | Rank | Pitcher | B/P | HR/FB | Tier | Form | WT | BP | HR? |
|---|---|---|---|---|---|---|---|---|---|
| 2026-06-21 | #76 | Zack Wheeler | L/R * | 14.2% | ⚪ D | ❄ COLD | ⚠️ | · | |
| 2026-06-18 | #31 | Aaron Nola | L/R * | 18.7% | ⚪ D | 📉 COOL | ⚠️ | · | |
| 2026-06-16 | #24 | Brady Singer | L/R * | 24.0% | 🔵 C+ | 📉 COOL | ⚠️ | · | |
| 2026-06-15 | #21 | Chase Burns | L/R * | 33.6% | 🟢 A | ➖ NTRL | ⚠️ | · | |
| 2026-06-14 | #81 | Bryce Elder | L/R * | 21.7% | 🔵 C+ | ➖ NTRL | ⚠️ | · | |
| 2026-06-12 | #30 | Spencer Strider | L/R * | 21.8% | 🔵 C+ | 📈 WARM | ✅ | · | |
| 2026-06-11 | #24 | Hunter Dobbins | L/R * | 20.8% | 🔵 C+ | 📈 WARM | ⚠️ | ||
| 2026-06-10 | #46 | Andre Pallante | L/R * | 23.9% | 🔵 C+ | 📈 WARM | ⚠️ | · | |
| 2026-06-09 | #48 | Dustin May | L/R * | 22.5% | 🔵 C+ | 📈 WARM | ⚠️ | · | |
| 2026-06-07 | #18 | Randy Vásquez | · | 24.4% | 🔵 C+ | 📈 WARM | · | · | · |
| 2026-06-03 | #57 | George Kirby | · | 19.0% | ⚪ D | 📈 WARM | · | · | · |
| 2026-05-31 | #150 | John King | · | 8.1% | ⚪ D | 📈 WARM | · | · | · |
| 2026-05-30 | #217 | Tyler Phillips | · | 6.5% | ⚪ D | ❄ COLD | · | · | |
| 2026-05-29 | #196 | Max Meyer | · | 6.5% | ⚪ D | ❄ COLD | · | · | · |
| 2026-05-26 | #137 | Chase Burns | · | 10.2% | ⚪ D | 📈 WARM | · | · | · |
| 2026-04-12 | #107 | Aaron Civale | · | 3.9% | ⚪ D | ➖ NTRL | · | · | · |
| 2026-04-10 | #224 | J.T. Ginn | · | 4.8% | ⚪ D | 📈 WARM | · | · | · |