 ATH
ATH
@
4:10p
 SD
SD
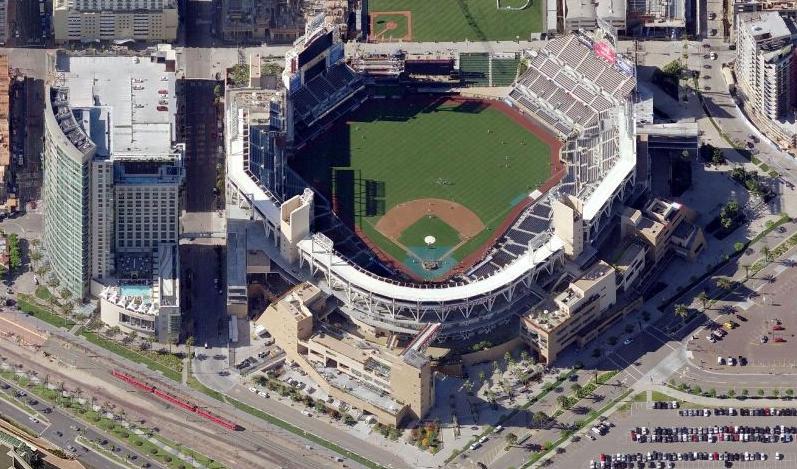
Park Factor
0.91×
Weather Mod
-1.0%
cool air · steady wind in · roof open
Combined
0.822
Temp
63.2°F
Wind
8.1 mph
in
Roof
open

Luis Medina
RHP
9 batters
| # | Batter | Score | Tier | Odds | Form | Rank | ISO ?Isolated Power — career SLG minus AVG. >.220 elite, .180–.220 above avg, <.140 below avg. | EV ?Avg Exit Velocity (mph) — Statcast season-to-date. >92 elite, 89–92 above avg, <86 below avg. | Barrel% ?Barrel rate vs. this pitch mix — percentage of contact classified as barrels (perfect EV + LA combo). >12% elite, 8–12% above avg. | HR/FB ?Batter HR / Fly Ball rate — career, all pitchers. >18% elite, 14–18% above avg, <10% below avg. | HR Dist ?Average distance (ft) of this batter's HRs. >400ft elite raw power, 380–400 above avg. | Sea HR% ?Season HR rate (HRs / PAs so far this year). v3.5 model feature — top backtest contributor. | 14d Pace ?Recent 14-day HR pace (HRs / games started). v3.5 model feature — captures current form. | Match% ?HR/FB Matchup — combined batter × pitcher HR/FB rate. The headline "how favorable is this matchup" number. | BBE ?Sample size — batted-ball events. <30 = small sample, treat stats with caution. | |
|---|---|---|---|---|---|---|---|---|---|---|---|---|---|---|---|---|
| 1 |

|
Gavin Sheets | 65 | 🔵 C+ | · | · | 29 | 0.276 | 89.5 | 10.5% | 37.0% | 402 | 13.6% | 27.3% | 26.1% | 27 |
| 2 |

|
Miguel Andujar | 58 | 🟠 C | · | 🌤️ WARM | 54 | 0.200 | 88.4 | 7.4% | 21.1% | 394 | 15.6% | 27.3% | 19.3% | 39 |
| 3 |

|
Ty France | 48 | ⚪ D | · | 🌧️ COOL | 104 | 0.219 | 90.7 | 12.3% | 33.3% | 401 | 0.0% | 0.0% | 15.4% | 11 |
| 4 |

|
Manny Machado | 47 | ⚪ D | · | · | 112 | 0.162 | 90.3 | 8.6% | 26.1% | 396 | 15.6% | 18.2% | 13.8% | 31 |
| 5 |

|
Ramón Laureano | 47 | ⚪ D | · | 🌧️ COOL | 113 | 0.179 | 89.1 | 12.4% | 23.1% | 405 | 6.1% | 9.1% | 12.8% | 18 |
| 6 |

|
Xander Bogaerts | 37 | ⚪ D | · | 🌧️ COOL | 190 | 0.137 | 88.0 | 8.7% | 23.3% | 392 | 13.3% | 0.0% | 8.7% | 30 |
| 7 |

|
Jackson Merrill | 36 | ⚪ D | · | 🌧️ COOL | 198 | 0.121 | 89.8 | 10.0% | 12.5% | 408 | 9.1% | 0.0% | 6.3% | 23 |
| 8 |

|
Rodolfo Durán | 35 | ⚪ D | · | · | 207 | · | 93.6 | 17.2% | 0.0% | 386 | 0.0% | 0.0% | 8.6% | 0 |
| 9 |

|
Fernando Tatis Jr. | 22 | ⚪ D | · | ❄ COLD | 268 | 0.037 | 90.9 | 10.8% | 0.0% | · | 0.0% | 0.0% | 5.8% | 34 |
Michael King
RHP
9 batters
| # | Batter | Score | Tier | Odds | Form | Rank | ISO ?Isolated Power — career SLG minus AVG. >.220 elite, .180–.220 above avg, <.140 below avg. | EV ?Avg Exit Velocity (mph) — Statcast season-to-date. >92 elite, 89–92 above avg, <86 below avg. | Barrel% ?Barrel rate vs. this pitch mix — percentage of contact classified as barrels (perfect EV + LA combo). >12% elite, 8–12% above avg. | HR/FB ?Batter HR / Fly Ball rate — career, all pitchers. >18% elite, 14–18% above avg, <10% below avg. | HR Dist ?Average distance (ft) of this batter's HRs. >400ft elite raw power, 380–400 above avg. | Sea HR% ?Season HR rate (HRs / PAs so far this year). v3.5 model feature — top backtest contributor. | 14d Pace ?Recent 14-day HR pace (HRs / games started). v3.5 model feature — captures current form. | Match% ?HR/FB Matchup — combined batter × pitcher HR/FB rate. The headline "how favorable is this matchup" number. | BBE ?Sample size — batted-ball events. <30 = small sample, treat stats with caution. | |
|---|---|---|---|---|---|---|---|---|---|---|---|---|---|---|---|---|
| 1 |

|
Zack Gelof | 61 | 🔵 C+ | · | 🌤️ WARM | 44 | 0.215 | 90.4 | 9.3% | 31.2% | 396 | 50.0% | 50.0% | 22.4% | 41 |
| 2 |

|
Nick Kurtz | 58 | 🟠 C | · | · | 56 | 0.200 | 94.6 | 12.3% | 38.9% | 411 | 17.0% | 25.0% | 22.7% | 27 |
| 3 |

|
Shea Langeliers | 57 | 🟠 C | · | 🌧️ COOL | 61 | 0.261 | 91.9 | 11.6% | 27.3% | 415 | 19.6% | 9.1% | 16.6% | 37 |
| 4 |

|
Tyler Soderstrom | 38 | ⚪ D | · | ❄ COLD | 180 | 0.186 | 90.1 | 10.2% | 13.9% | 393 | 8.7% | 0.0% | 9.6% | 37 |
| 5 |

|
Carlos Cortes | 37 | ⚪ D | · | 🌧️ COOL | 189 | 0.181 | 91.3 | 8.8% | 19.1% | 396 | 3.2% | 0.0% | 10.0% | 25 |
| 6 |

|
Alika Williams | 34 | ⚪ D | · | 🌤️ WARM | 214 | 0.118 | 83.0 | 11.2% | 0.0% | · | 0.0% | 0.0% | 7.4% | 1 |
| 7 |

|
Jeff McNeil | 30 | ⚪ D | · | 🌤️ WARM | 233 | 0.093 | 86.3 | 3.7% | 10.5% | 380 | 4.3% | 8.3% | 6.4% | 33 |
| 8 |

|
Jonah Heim | 20 | ⚪ D | · | ❄ COLD | 271 | 0.114 | 84.6 | 6.1% | 0.0% | 425 | 0.0% | 0.0% | 5.3% | 11 |
| 9 |

|
Henry Bolte | 6 | ⚪ D | · | · | 288 | · | 89.3 | · | 0.0% | · | 0.0% | 0.0% | 8.7% | 0 |